Using Code Coverage
![[Previous]](prev.gif) |
![[Contents]](contents.gif) |
![[Index]](keyword_index.gif) |
![[Next]](next.gif) |
Using Code Coverage
You can select a topic from this diagram:
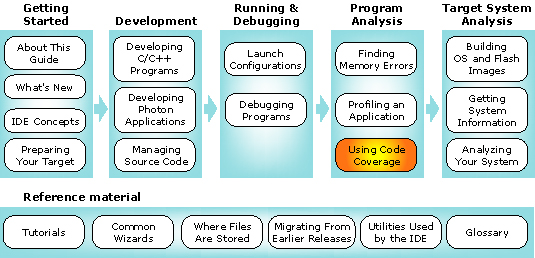
Use the Code Coverage tool to help test your code.
In this chapter:
- Code coverage in the IDE
- Enabling code coverage
- Importing gcc code coverage data from a project
- Associated views
Code coverage in the IDE
Code coverage is a way to measure how much code a particular process has executed during a test or benchmark. Using code-coverage analysis, you can then create additional test cases to increase coverage and determine a quantitative measure of code coverage, which is an indirect measure of the quality of your software (or better, a direct measure of the quality of your tests).
Types of code coverage
Several types of metrics are commonly used in commercial code-coverage tools, ranging from simple line or block coverage (i.e. "this statement was executed") to condition-decision coverage (i.e. "all terms in this Boolean expression are exercised"). A given tool usually provides a combination of types.
The coverage tool in the IDE is a visual front end to the gcov metrics produced by the gcc compiler. These coverage metrics are essentially basic block coverage and branch coverage.
The IDE presents these metrics as line coverage, showing which lines are fully covered, partially covered, and not covered at all. The IDE also presents percentages of coverage in terms of the actual code covered (i.e. not just lines).
Block coverage
Block coverage, sometimes known as line coverage, describes whether a block of code, defined as not having any branch point within (i.e. the path of execution enters from the beginning and exits at the end) is executed or not.
By tracking the number of times the block of code has been executed, the IDE can determine the total coverage of a particular file or function. The tool also uses this information to show line coverage by analyzing the blocks on each line and determining the level of coverage of each.
Branch coverage
Branch coverage can track the path of execution taken between blocks of code. Although this metric is produced by the gcc compiler, currently the IDE doesn't provide this information.
How the coverage tool works
The IDE's code coverage tool works in conjunction with the compiler (gcc), the QNX C library (libc), and optionally the remote target agent (qconn). When code coverage is enabled for an application, the compiler instruments the code so that at run time, each branch execution to a basic block is counted. During the build, the IDE produces data files in order to recreate the program's flow graph and to provide line locations of each block.
 |
Since the IDE creates secondary data files at compilation
time, you must be careful when building your programs in a
multitargeted build environment such as QNX Neutrino.
You must either:
Note also that the compiler's optimizations could produce unexpected results, so you should perform coverage tests on an unoptimized, debug-enabled build. |
When you build a program with the Build with Code Coverage build option enabled and then launch it using a C/C++ QNX Qconn (IP) launch configuration, the instrumented code linked into the process connects to qconn, allowing the coverage data to be read from the process's data space.
But if you launch a coverage-built process with coverage disabled in the launch configuration, this causes the process to write the coverage information to a data file (.da) at run time, rather than read it from the process's data space.
 |
You should use data files only if you're running the local launch configuration on a QNX Neutrino self-hosted development system. Note that you can later import the data into the IDE code coverage tool. For information about importing gcc coverage data from a project, see "Importing gcc code coverage data from a project" later in this chapter. |
Once a coverage session has begun, you can immediately view the data. The QNX Code Coverage perspective contains a Code Coverage Sessions view that lists previous as well as currently active sessions. You can explore each session and browse the corresponding source files that have received coverage data.
Enabling code coverage
To build executables with code coverage enabled:
- In the C/C++ Projects view, right-click your project and select Properties. The properties dialog for your project appears.
- In the left pane, select QNX C/C++ Project.
- In the Build Options pane, check Build with Code Coverage.
- In the Build Variants tab, check only one build variant.
If the IDE is set to build more than one variant, an error is displayed and the OK button is disabled. - Click OK.
- In the C/C++ Projects view, right-click your project and select Clean....
- Be sure that your project is selected, and check the Start a build immediately box, then click OK to rebuild your project.
Enabling code coverage for Standard Make projects
If you're using your own custom build environment, rather than QNX Makefiles, you'll have to manually pass the coverage option to the compiler.
To enable code coverage for non-QNX projects:
- Compile using these options to gcc:
-fprofile-arcs -ftest-coverage
If you're using qcc, compile with:
-Wc,-fprofile-arcs -Wc,-ftest-coverage
- Link using the -p option.
For example, your Makefile might look something like this:
objects:=Profile.o main.o

CC:=qcc -Vgcc_ntox86
CFLAGS:=-g -Wc,-ftest-coverage -Wc,-fprofile-arcs -I. -I../proflibCPP-std
LDFLAGS:=-p -g -L../proflibCPP-std -lProfLib -lcpp

all: profileCPP-std

clean:
    -rm $(objects) profileCPP-std *.bb *.bbg

profileCPP-std: $(objects)
    $(CC) $^ -o $@ $(LDFLAGS)
Starting a coverage-enabled program
To start a program and measure the code coverage:
- Create a C/C++ QNX QConn (IP) launch configuration as you normally would, but don't click OK yet.
- On the launcher, click the Tools tab.
- Click Add/Delete Tool. The Tools selection dialog appears.
- Check the Code Coverage tool:
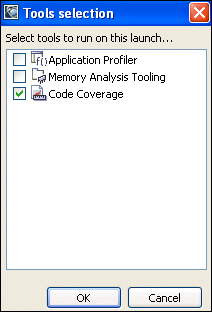
- Click OK.
- Click the Code Coverage tab, and fill in these fields:
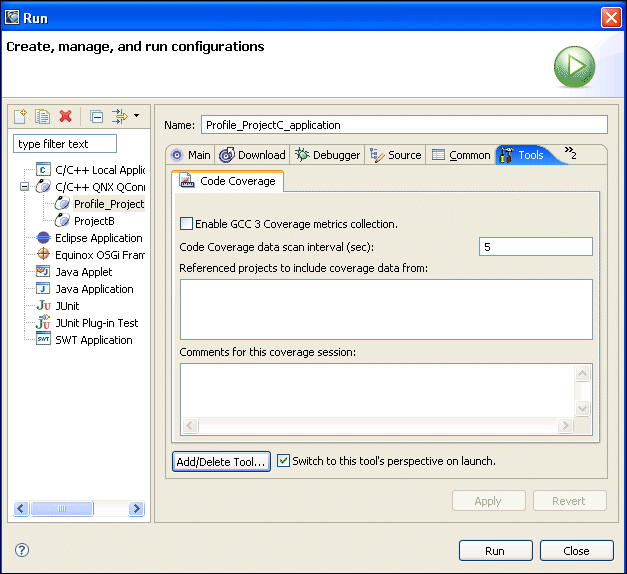
- Enable GCC 3 Coverage metrics collection
- Check this if your application was compiled with gcc 3.3 or later. The default is to collect code coverage information from applications compiled with gcc 2.95.
- Code Coverage data scan interval (sec)
- This option sets how often the Code Coverage tool polls for data. A low setting can cause continuous network traffic. The default setting of 5 seconds should suffice.
- Referenced projects to include coverage data from
- Check any project in this list you wish to gather code-coverage data for. Projects must be built with coverage enabled.
- Comments for this coverage session
- Your notes about the session, for your own personal use. The comments appear at the top of the generated reports.
- Check Switch to this tool's perspective on launch if you want to automatically go to the QNX Code Coverage perspective when you run or debug. toolsselection.gif
- Click Apply.
- Click Run or Debug.
Importing gcc code coverage data from a project
If you launched a code coverage-enabled build process and chose to disable code coverage in the launch configuration, the process writes the coverage information to a data file (.da) at run time, rather than read it from the process's data space. This means that you can choose to import this data into the IDE Code Coverage tool at a later time.
To import gcc code coverage data from a project:
- Create and build a project with code coverage selected. For information about enabling code coverage, see "Enabling code coverage" earlier in this chapter.
- Create a launch configuration where code coverage is disabled.
- Run this configuration.
- Observe the target's directory using the Target File System Navigator tab
in the Tasks view (bottom of the Workbench window) in the
location where the file project_name.da resides.
By default, you will not have the Target File System Navigator tab in your Tasks view. To add this tab to your view:
- Select .
- Expand QNX Targets.
- Select Target File System Navigator.
- Click OK.
- For the target, right-click on the file project_name.da and select .
- In the Select Target Folder window, specify a folder location to copy the file, and click OK.
The project_name.da will be visible under the C/C++ tab for the corresponding project.
- On the QNX Code Coverage tab, select .
- Specify the name of the session, click Browse to locate a project, and then click OK.
- Click Finish.
Now, the Code Coverage tab displays the session name and imported gcc code coverage data for the selected project.
Associated views
The QNX Code Coverage perspective includes the following views:
- Code Coverage Sessions View (controlling your session and examining data line-by-line)
- Code Coverage Properties View (seeing your coverage at a glance)
- Code Coverage Report View (examining your coverage report)
Code Coverage Sessions View
The Code Coverage Sessions view lets you control and display multiple code-coverage sessions:
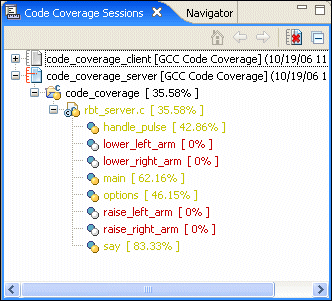
The view displays the following as a hierarchical tree for each session:
| Session item | Description | Possible icons |
|---|---|---|
| Code coverage session | Launch configuration name, coverage tool, and start time (e.g. ccov102_factor [GCC Code Coverage] (7/2/03 2:48 PM)) | 
 |
| Project | Project name and amount of coverage (e.g. ccov102_factor [ 86.67% ]) |  |
| File | Filename and amount of coverage (e.g. ccov102_factor.c [ 86.67% ]) |  |
| Function | Function name and amount of coverage (e.g. main [ 100% ]) |  |
The IDE uses several icons in this view:
| Icon | Icon Color | Meaning |
|---|---|---|
 |
White | No coverage |
 |
Yellow | Partial coverage |
 |
Green | Full (100%) coverage |
 |
Missing or out-of-date source file |
The IDE also adds a coverage markup icon ( ) to indicate source markup in the editor.
(See the "Examining data line-by-line" section, below.)
) to indicate source markup in the editor.
(See the "Examining data line-by-line" section, below.)
To reduce the size of
the hierarchical tree, click the Collapse All
( ) button.
To combine several sessions:
- In the Code Coverage Sessions view, select the sessions you want to combine.
- Right-click your selections and select Combine/Copy Sessions. The IDE prompts you for a session name and creates a combined session.
Examining data line-by-line
The IDE can display the line-by-line coverage information
for your source code. In the left margin, the editor
displays a "covered" icon ( ) beside
each line of source. In the right margin, the editor
displays a summary of the coverage by showing green sections for
fully-covered code, yellow for partial coverage, and red for no coverage:
) beside
each line of source. In the right margin, the editor
displays a summary of the coverage by showing green sections for
fully-covered code, yellow for partial coverage, and red for no coverage:
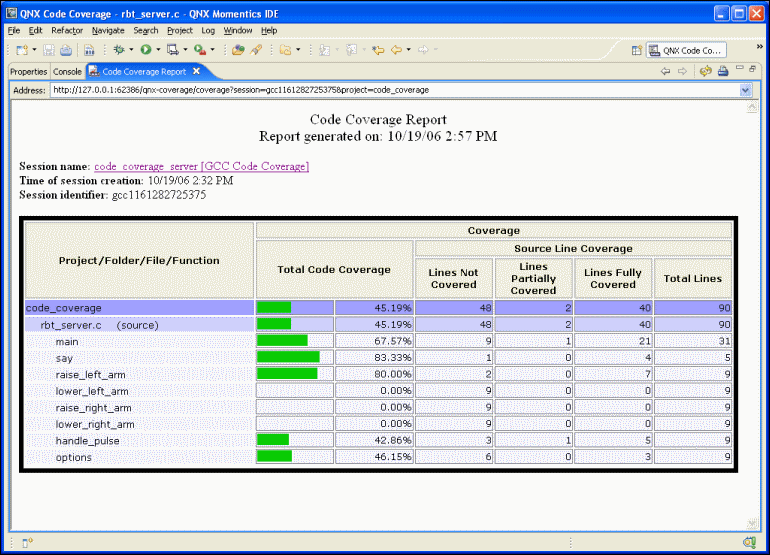
The Code Coverage Report view provides a summary (in XML) of your session. The view lets you "drill down" into your project and see the coverage for individual files and functions:
Generating a report
To generate a report, right-click a coverage session and select Generate Report.
By default, the IDE displays reports in the Code Coverage Report view, but you can also have the IDE display reports in an external browser. Using an external browser lets you compare several reports simultaneously.
Changing views
To toggle between viewing reports in the Code Coverage Report view and in an external browser:
- Open the Preferences dialog ().
- In the left pane, select .
- In the right pane, enable/disable the Use external Web browser check box.
- Click OK.
Printing a report
- To print a report:
-
In the Code Coverage Report view's title bar, click the
Print button (
 ).
).
Saving a report
To save a report:
- Right-click in the Code Coverage Report view to display the context menu.
- Click Save As... to save the report./neutrino
Refreshing a report
- To refresh a report:
-
In the Code Coverage Report view's title bar, click the
Refresh button (
 ).
).
The Code Coverage Report view provides a summary (in XML) of your session. The view lets you "drill down" into your project and see the coverage for individual files and functions:
Opening a file in the Code Coverage perspective
- To open a file in the QNX Code Coverage perspective:
- In the Code Coverage Sessions view, expand a session and double-click a file or function.
Dispalying coverage information for a specific session
- To display coverage information from a particular session:
- In the Code Coverage Sessions view, right-click a session and select Coverage Markup, then select one of the following:
- Mark lines not covered
- Mark lines partially covered
- Mark lines fully covered
The selected icon appears beside the corresponding source in
the C/C++ editor. In the Code Coverage Sessions view, a
coverage marker () overlays the source file
icon.
Displaying coverage information when opening a file
To automatically show coverage information when opening a file:
- Open the Preferences dialog ().
- In the left pane, select .
- In the right pane, check the desired markers in the Coverage markup when file is opened field.
- Click OK. The next time you open a file, the markers appear automatically. To add markers from another session, add them manually, as described above.
Removing coverage markers
- To remove all coverage markers:
-
In the Code Coverage Sessions view's title bar, click the
Remove All Coverage Markers button (
 ).
).
Code Coverage Properties View
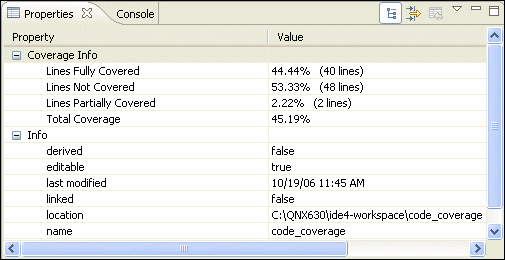
The Properties view displays a summary of the code coverage for a project, file, or function you've selected in the Code Coverage Sessions view.
The Properties view tells you how many lines were covered, not covered, and so on:
Code Coverage Report View
The Code Coverage Report view provides a summary (in XML) of your session. The view lets you "drill down" into your project and see the coverage for individual files and functions:
Generating a report
To generate a report, simply right-click a coverage session and select Generate Report.
By default, the IDE displays reports in the Code Coverage Report view, but you can also have the IDE display reports in an external browser. Using an external browser lets you compare several reports simultaneously.
Changing views
To toggle between viewing reports in the Code Coverage Report view and in an external browser:
- Open the Preferences dialog ().
- In the left pane, select .
- In the right pane, enable/disable the Use external Web browser check box.
- Click OK.
Printing a report
- To print a report:
-
In the Code Coverage Report view's title bar, click the
Print button ().
Saving a report
To save a report:
- Right-click in the Code Coverage Report view to display the context menu.
- Click Save As... to save the report.
Refreshing a report
- To refresh a report:
-
In the Code Coverage Report view's title bar, click the
Refresh button ().
|
|
|
|