What's New
![[Previous]](prev.gif) |
![[Contents]](contents.gif) |
![[Index]](keyword_index.gif) |
![[Next]](next.gif) |
What's New
You can select a topic from this diagram:
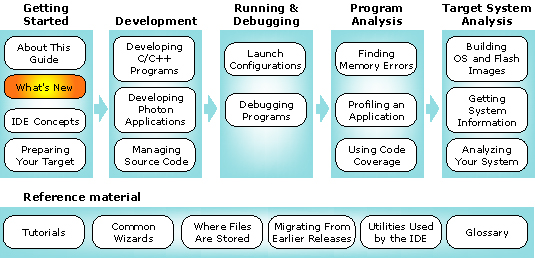
This chapter identifies the changes made to the QNX Momentics IDE.
In this chapter:
- What's new IDE 4.0.1?
- What was new in IDE 4.0?
- What was new in IDE in 6.3.0 SP3?
- What was new in IDE in 6.3.0 SP2?
- What was new in IDE in 6.3.0 SP1?
What's new in IDE 4.0.1?
IDE 4.0.1 includes the following new features:
- Support for Windows Vista
- IDE supports self-hosted Solaris and Neutrino OSs
- Eclipse updates
- General improvements
- Improvements to upgrading your software
- Download Center updates
- Documentation updates
Support for Windows Vista
- Full support for the Windows Vista OS
- QNX IDE workbench version 4.0.1 includes support for the Windows Vista operating system. For a complete list of supported host and targets, see the QNX IDE Momentics Release Notes.
- Windows Vista patch available for download to support the QNX win32 SDK
- The QNX Download Center includes a patch to provide you with Windows Vista support for the QNX win32 SDK. This patch includes an updated version of the core file cygwin1.dll, uname.exe, and bash.exe.
IDE supports self-hosted Neutrino and Solaris
- The IDE Workbench now supports self-hosted Neutrino and Solaris configurations.
Eclipse updates
In IDE 4.0.1, you can upgrade to use Eclipse platform version 3.2.2, and the Eclipse CDT to version 3.1.2. For detailed information about the changes made to the Eclipse Platform and CDT, see the Eclipse.org website.
General improvements
IDE 4.0.1 includes various overall improvements to the application. For a detailed list of these improvements, see the release notes.
Improvements to upgrading your software
In addition to updating your IDE features and qconn, you can now use the Software Updates manager to quickly update the IDE software.
 |
If you have an existing installation of IDE 4.0 on your machine, you can use the IDE Software Updates manager to update the IDE to version 4.0.1 (see the topic "Upgrading using the IDE Software Update manager" in the installation notes for Windows and Linux hosts; for Solaris and Neutrino, you will need to follow the typical installation instructions for a new installation. |
Download Center updates
For this release of the IDE, the Download center has an update to qconn and to the malloc library. For instructions about using the Software Update Manager, see the installation notes for Windows or Linux, or see the QNX Momentics IDE Online Help.
Documentation updates
The documentation includes various improvements and enhancements. For a list of some of these improvements, see the items under the heading, "List of fixes" in the release notes. In addition, a printed version of the QNX Momentics IDE User's Guide is also available.
What was new in IDE 4.0?
IDE 4.0 included the following new features:
- Application Profiler perspective
- System Profiler perspective
- Memory Analysis perspective
- System Information perspective
- System Builder perspective
- Managed Make for QNX projects
- C/C++ development
- Momentics workbench
- Debugging
Application Profiler perspective
- Full profiling support for shared libraries and DLLs (requires the libc patch)
- Call information is included by instrumented shared libraries and DLLs. Callout-type calls from noninstrumented to instrumented code are now shown.
- Background symbol loading
- Symbol loading is now performed in a background thread, resulting in enhanced user experiences, because you no longer have to wait for the profiler to initialize itself loading symbols during the launch startup process.
System Profiler perspective
- Configuration settings
- You can now save and load (as well as import and export) System Profile configuration settings. System Profiler sessions are now controlled through the standard Launch Configuration mechanism.
- Adaptive Partition Summary view
- Shows adaptive-partition usage and summary information, including:
- reporting the bankruptcy/critical information in the summary
- displaying the critical areas in the timeline
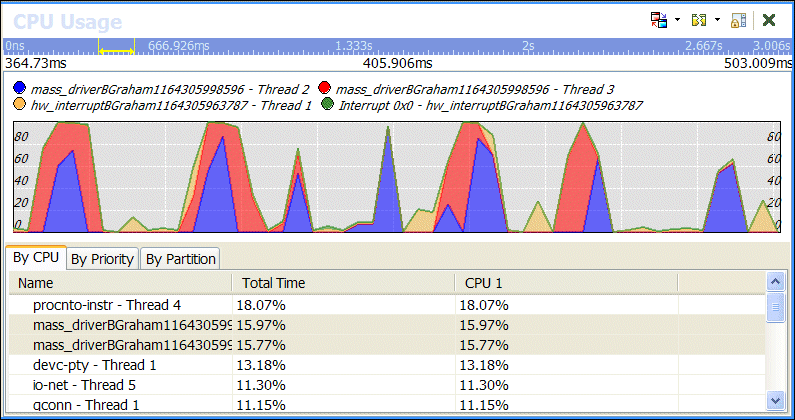
- CPU usage
- The CPU Usage pane displays a thread's partition and priority and is now a tabbed view that presents the display of CPU usage sliced by CPU, partition, and priority. You can easily sort and export this information. In addition, the functionality of the Process Activity editor pane and the CPU Usage editor pane have been merged together.
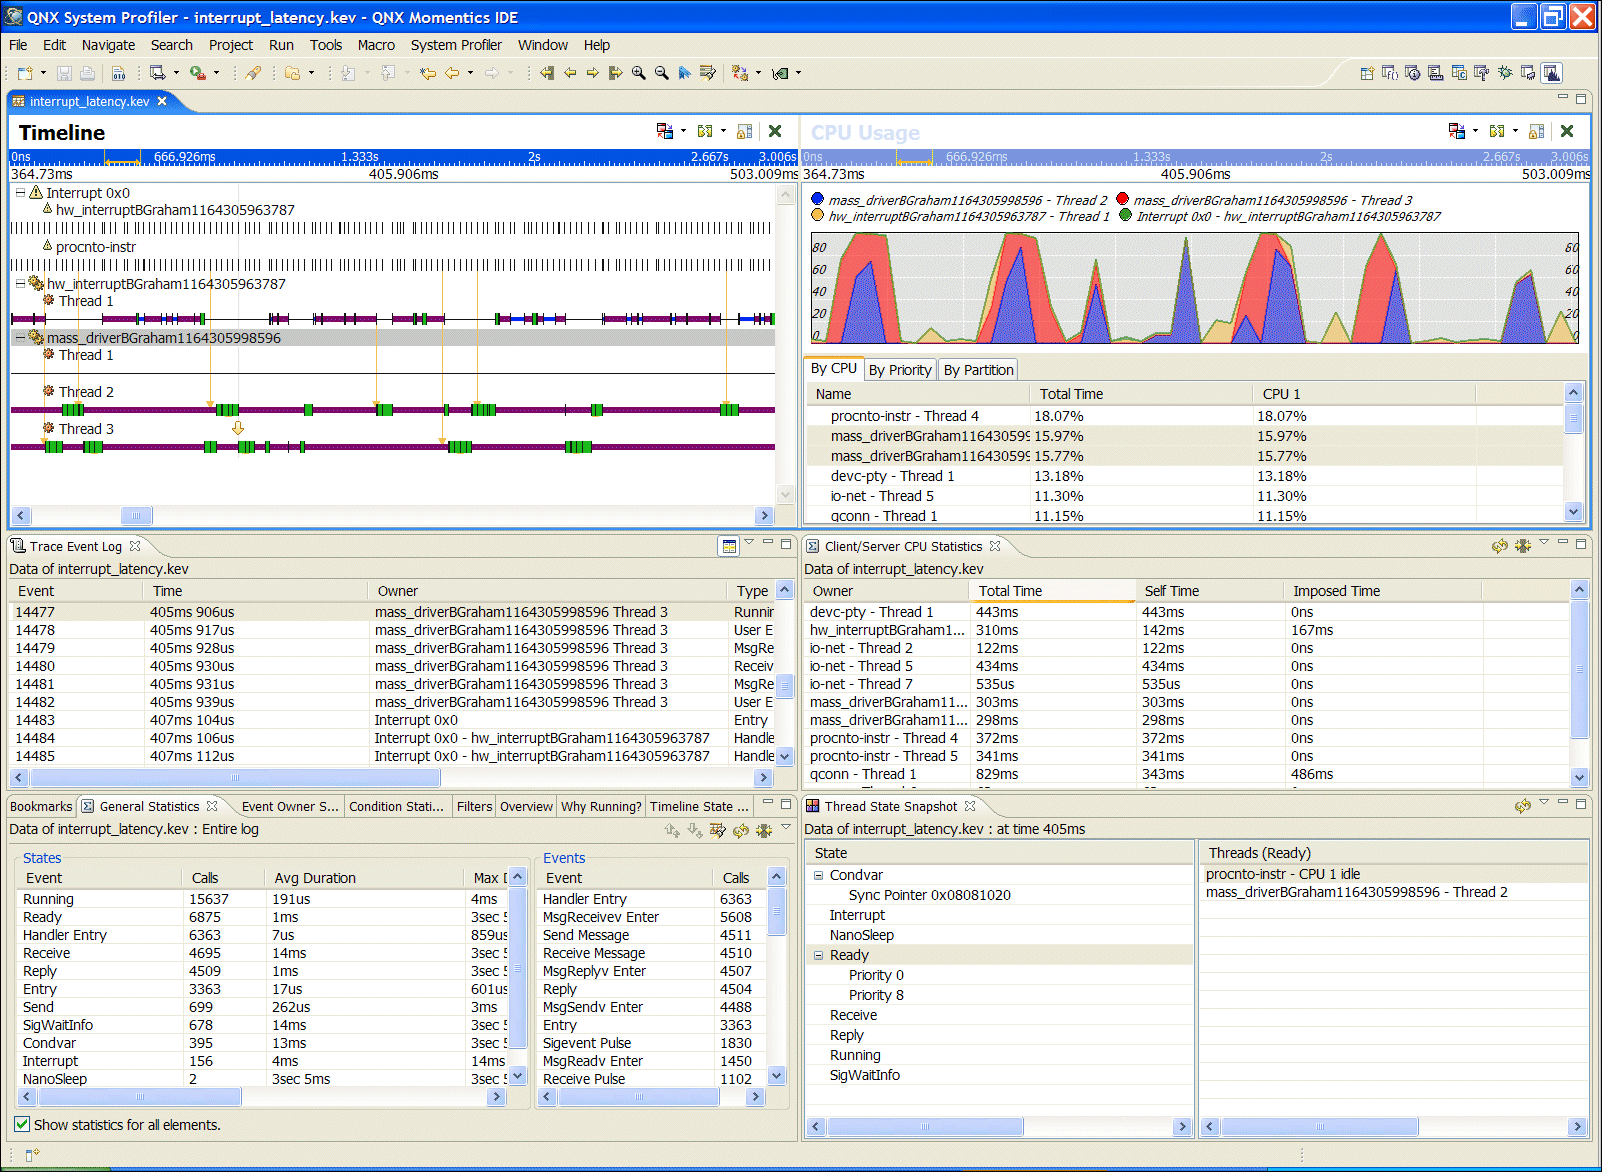
- Timeline navigation and usability improvements
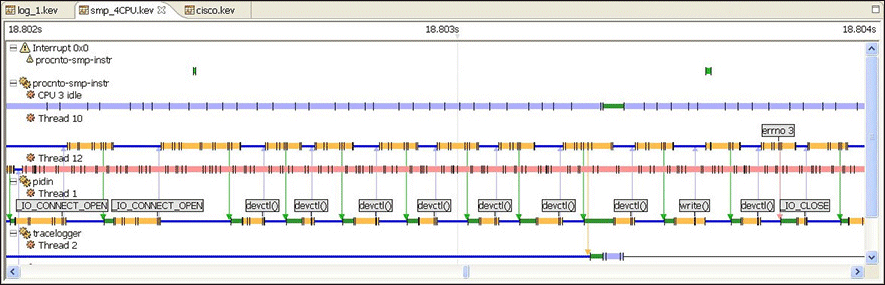
- The System Profiler Timeline display provides insight into the
execution of the system, broken down by individual process, thread, and
interrupt activity.
Improving the ability to navigate through the system events lets you quickly zoom into problem areas or follow the flow of activity, matching what you see visually in the timeline with what you expect to occur in your systems.
Specific improvements include:
- Direct event and event owner position highlighting. Simply double-click on an event in the event log display, and the timeline immediately jumps to that event.
- Event navigation by selected event owners. Navigate along an execution timeline for a particular thread, forward and backward, quickly and easily with a click of a button.
- The Jump To Event dialog lets you collaborate more easily with your colleagues by providing direct event navigation by event index, event cycle, or natural time.
- The Timeline State Legend lets you quickly see and adjust the color-coding of the various system states in the timeline.
- Enhanced data searching, filtering and reduction capabilities
- The instrumented kernel log files can easily generate tens, if not
hundreds, of megabytes of information in a short period of time. This amount of
information provides a good context for examining problems, but is
often more data than is required to highlight a problem to another
developer.
This version of the System Profiler lets you save and create new log files that contain only a relevant subset of the data required for other developers to understand problems. New log files can be created focusing on only a particular range of time, and filtering out unnecessary events or event owners, such as server processes.
A new event data extraction and interpretation framework has been introduced with this release that allows event data conversions, particularly of User Events, to be more powerfully applied. Users can now describe their own events using C-style data structures. Accompanying this new framework is a new Event Data Properties view that more clearly displays, in a tabular manner, the key/value data associated with individual events.
- New data analysis tools
- This release of the System Profiler provides you with some
additional analysis tools to help you understand the execution status
of their system and to give you more insight into why certain
sequences of events are occurring.
- Why Running view --
One of the most difficult tasks in a highly modularized software
system is tracing the flow of execution as it flows from one component
to another. The Why Running view works in conjunction with the
System Profiler editor's Timeline pane to provide them with a
single-click answer to the question "Why is this thread running?"
for whatever thread is actively executing at the current cursor position.
By repeating this action (or generating the entire running backtrace), you receive a clearer view about the sequence of activities leading up to their original execution position. Not to be confused with an execution backtrace, this "running backtrace" highlights the cause and effect relationship leading up to the initial execution position.
- Thread State Snapshot view -- In addition to asking why a particular process's thread may be running, developers are often faced with the task of understanding what the rest of the system is doing at a particular point in time. This question can easily be answered using the new Thread State Snapshot view. Like the Why Running view, this view is based on the current cursor position in the System Profiler editor's Timeline window. For a given time and position, it determines the state of all threads in the system, and it presents the information so that you can better determine if this system state is what you had originally anticipated.
- Client/Server CPU Usage Statistics --
An additional statistics panel has been added into the System
Profiler to compliment the graphical Usage and Active System Profiler
editor panes. This statistics table generates a map of both direct
and imposed CPU usage (based on the thread RUNNING state).
In a message-passing system, such as Neutrino, where servers are often working on behalf of clients, determining the true execution cost can be challenging. This new view helps with that endeavor. For each executing thread, this view contains the direct CPU time the thread executed, and if that thread communicated to another server, the amount of time that the server executed on its behalf is accumulated as imposed CPU usage to the client. You can then easily export this data can then be easily exported for use with other analysis and charting tools.
- Why Running view --
One of the most difficult tasks in a highly modularized software
system is tracing the flow of execution as it flows from one component
to another. The Why Running view works in conjunction with the
System Profiler editor's Timeline pane to provide them with a
single-click answer to the question "Why is this thread running?"
for whatever thread is actively executing at the current cursor position.
- General usability improvements
- There have been a large number of general usability and performance
improvements made to the System Profiling tools. Some of the more
interesting improvements include:
- Cut and paste support in tables (Trace Event Log, Why Running, Search, Statistics views) allowing you to more easily exchange small snippets of information with other developers by simply cutting and pasting the information from the System Profiler tools.
- There have been some significant changes to the Trace Event Search user interfaces to align with the new QNX Momentics workbench search frameworks. Search results can now be overlaid, one on top of the other, without having to generate compound search conditions. The results display in a more tabular format and can be grouped into clusters in addition, you can use the system clipboard to export the results.
Memory Analysis perspective
This perspective includes a completely new Memory Analysis Tooling that's reliable, fast, and robust, and with greatly improved performance and stability.
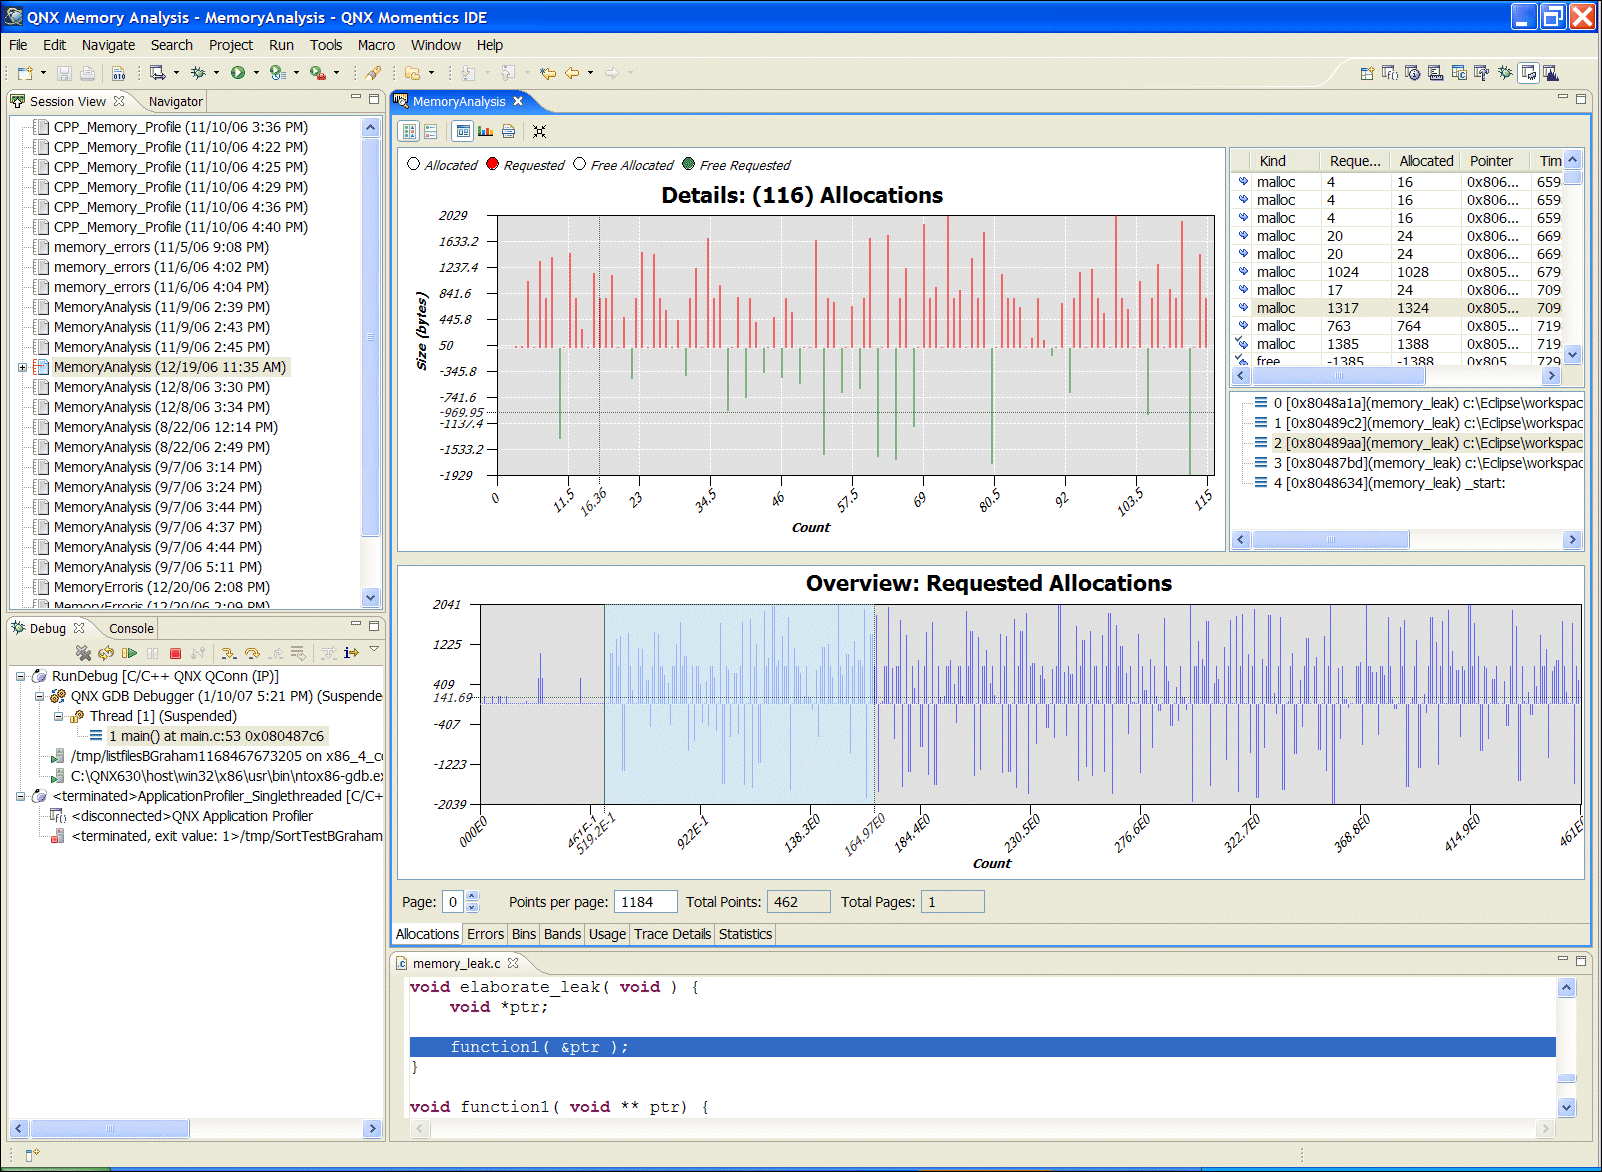
Its features include:
- multiple views, most of them including both alphanumeric and graphical representations
- 2D and 3D bar and differentiator charts that graphically present the memory events and traces, allowing you to use multiple ways to sort and filter out the collected information, allowing a generation of user statistics and allocation statistics over a time base
- displays of Bands, Bins, and Usage of the memory that let you replay the collected data
- a Trace Details view that lets you replay the selected bins, bands, or usage, synchronized with the allocations
- the ability to import data generated by the debug malloc library
- maintaining thread/process, shared library ownership and ordering/timing information of generated events if present
- detecting memory leaks -- snapshot in time, detecting specific string and memory functions errors
- support for Standard Make C Project memory events and C++ memory events, including backtrace information and traceability of events back to the source code if present
You can now:
- change the Memory Analysis settings for a running process
- import debug malloc events from logged trace events to a file on the target system
- perform memory analysis on a running program by launching with debug malloc or attaching to a running process
- reconnect to existing Memory Analysis sessions
System Information perspective
- Adaptive partitioning scheduler view
- A new APS view lets you view information about adaptive partitions on a running target system.
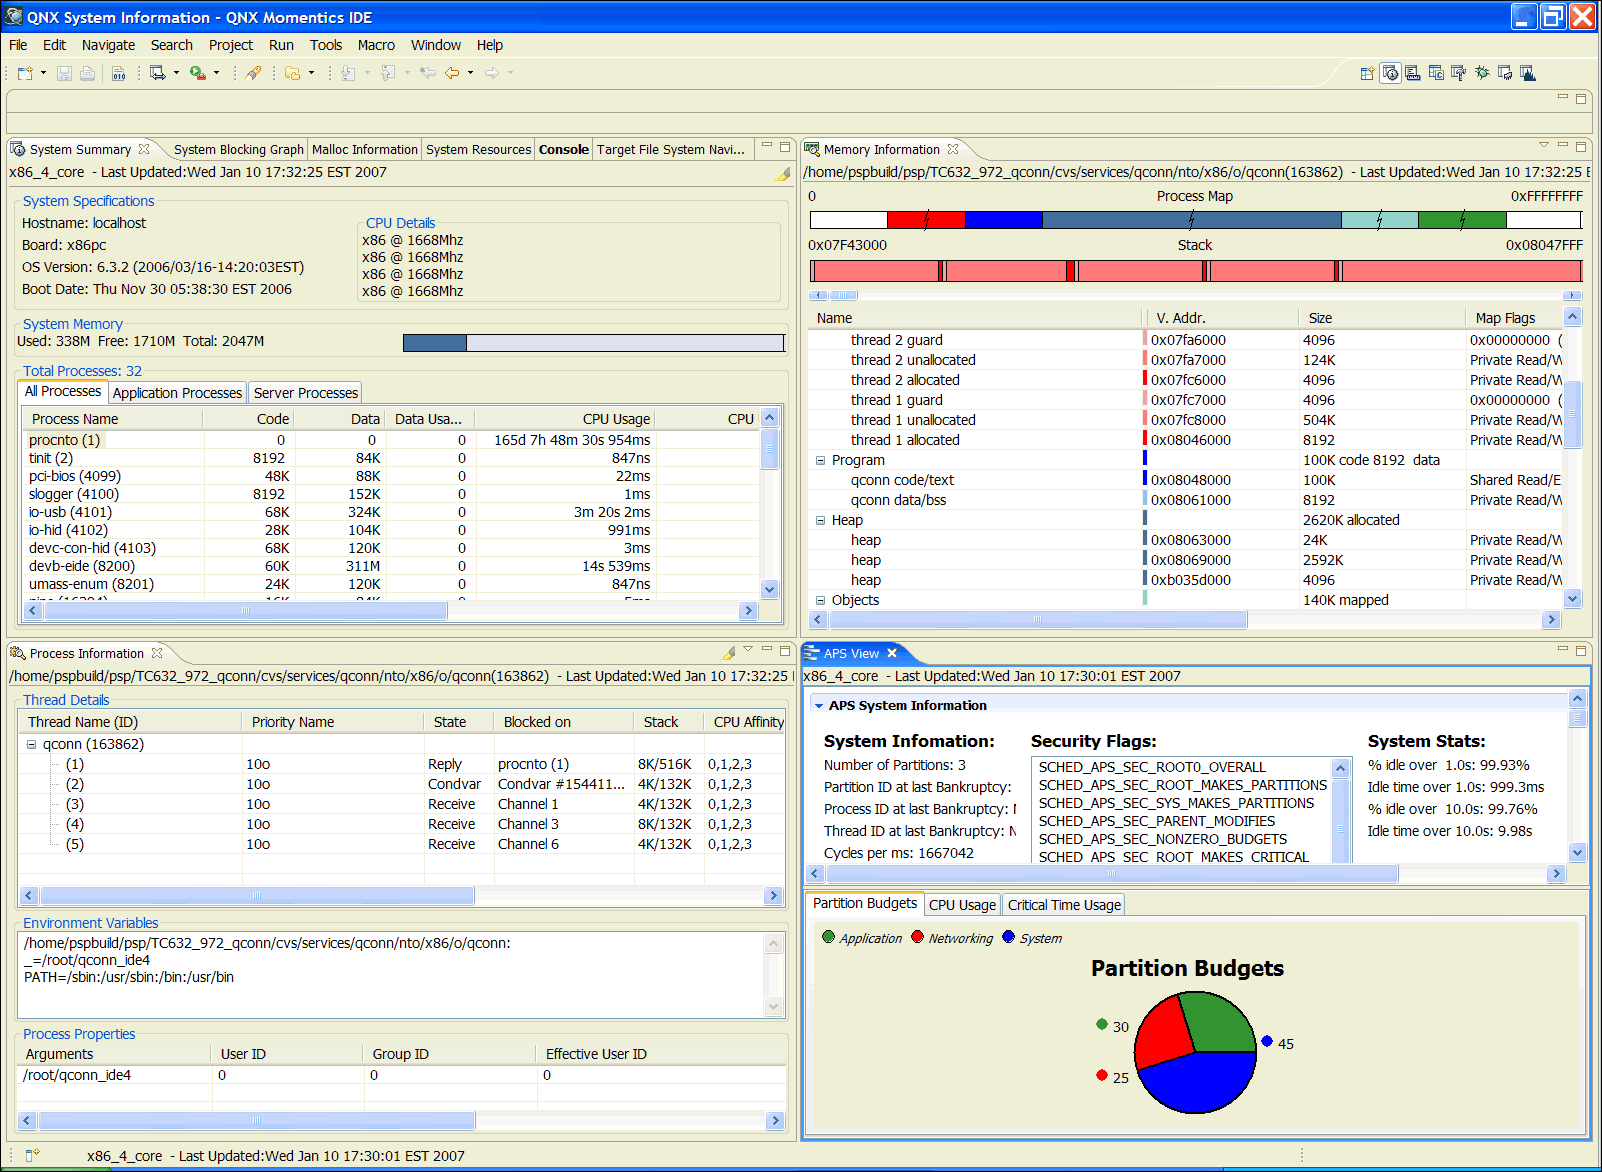
- CPU affinity and process priority/scheduling controls
- Threads and processes now have context menus that let you set the CPU affinity and change the process priority and scheduling algorithm. You can also change a thread's name on targets running QNX Neutrino 6.3.2 or later.
- Thread name support
- Thread names are now shown in System Information views, if available.
- Highlighting data changes
- Changing data is now highlighted in System Information views, and a delta is displayed for CPU/data usage.
System Builder perspective
- TFTP Server improvements
- The TFTP Server view includes several improvements:
- Network selection capability
- Improved user file search
- Search options and preferences available quickly from within the view
Managed Make for QNX projects
You can now create and use QNX Managed Make projects to handle building code dynamically for any and all QNX targets.
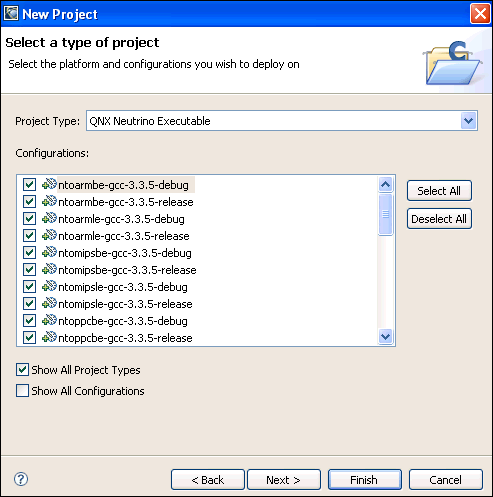
These are similar to QNX Projects except they provide a richer environment for setting compiler and linker options. They also let you use custom build steps and set environment variables and build macros for make. Managed Make projects can be created in the New Project Wizard under C or C++. Select QNX Neutrino Executable, Shared Library, or Static Library Project Type, and then select which Configurations to build for. There are configurations for each processor type, compiler version, and debug/release build options.
C/C++ development
C/C++ general improvements
- DOM-based language backend
- The C/C++ perspective is now served by a much more powerful language model in the form of a document object model (DOM) that helps make everything from the C/C++ outliner, to searching, to refactoring, to class browsing faster and more accessible to plugin developers.
- Kernighan & Ritchie (K&R) C language support
- In addition to the new DOM serving the backend source code model, the native parser is also much more tolerant of K&R C language dialects.
- Faster searches
- You will also notice significant improvements to the performance and speed of the C/C++ parser and the efficiency of the indexer. As a result, searches (both general and specific, such as searches for references and declarations) are faster and more accurate than in previous releases.
C/C++ user interface
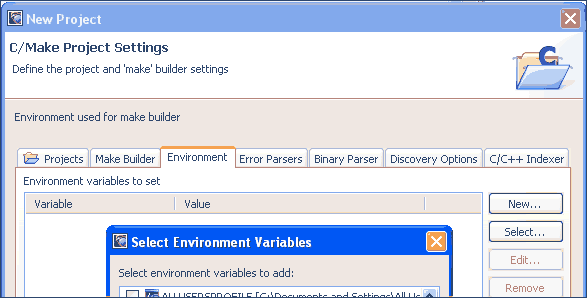
- Build environment control
- You can now fully configure the environment variables set when starting external build commands, through the Standard Make and Managed Build C/C++ project properties, or directly when creating new projects from the New C/C++ Project wizard.
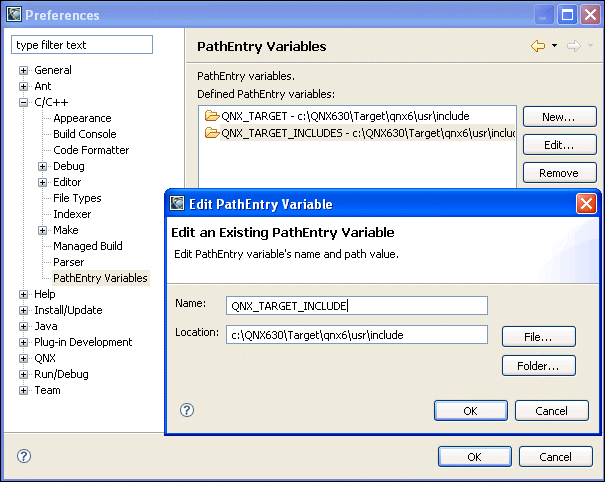
- PathEntry variables
- The PathEntry project properties are important for the correct operation of the parser. The new configuration lets developers configure a common set of variables that allow the sharing of projects more easily between different developer configurations. PathEntry variables provide you with a capability to open files and to load objects that are in one's CLASSPATH.
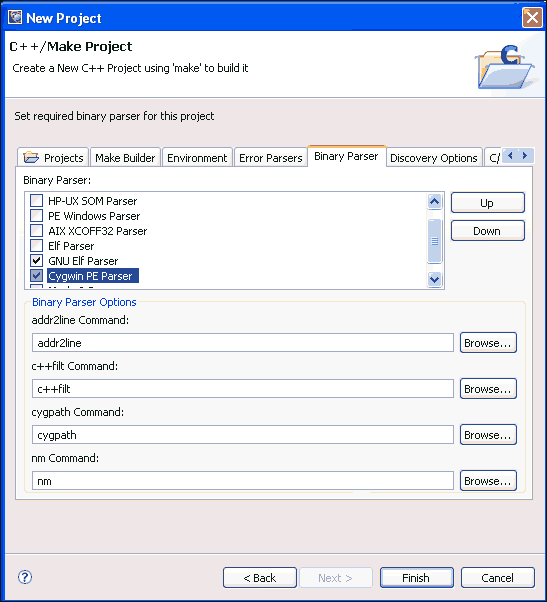
- Binary parser options
- The binary parsers are more generic with the capability to redefine what external commands they use for data interpretations. Configure the settings in the project properties, or at New Project creation time.
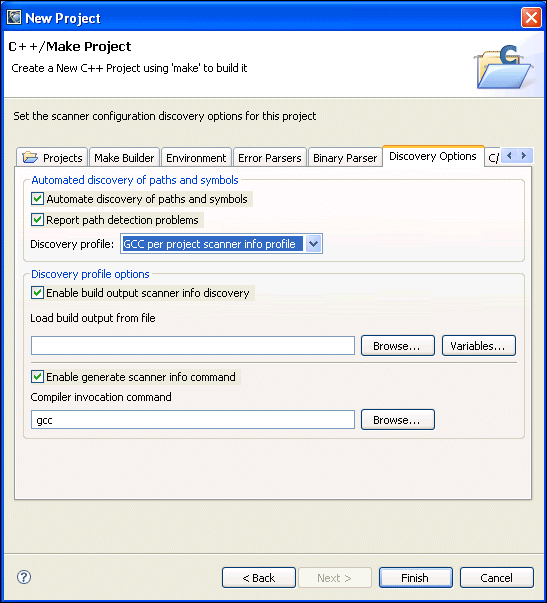
- New discovery capabilities
- Further work has been done to facilitate the discovery of compiler and project settings, including the ability to read from a build output file.
- Indexer selection
- The C/C++ source
indexers are now plugable components, each providing different feature
support, letting you select from:
- No indexing
- No support for searches or cross referencing.
- C/C++ parser-based indexing
- DOM model based, requires proper project configuration (defines and includes). Full searching, cross referencing and refactoring are supported.
- Drag-and-drop support
- The C/C++ Project and the C/C++ Outline views have improved support for dragging and dropping of code elements and binaries.
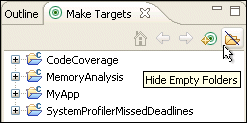
- Make Target filters
- You can reduce the clutter in the Make Targets view by
enabling the Hide Empty Folders filter.
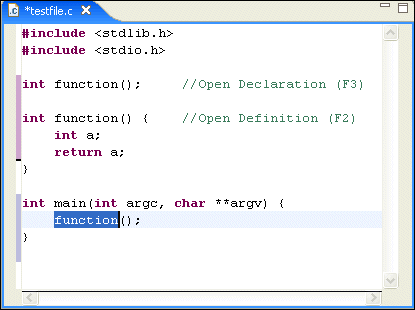
- Jump to definition
- Complementing the already
existing Open Declaration, also known as F3, is
the powerful Open Definition
(Ctrl-F3) that takes you directly to
the definition of the class or type you're looking for.
- New editing commands
- Do more with less effort; additional C/C++ Editor key bindings are available for more flexible annotation and marker navigation.
C/C++ indexers
The C/C++ indexers have been substantially improved for greater performance and scalability.
The IDE lets you select the indexers to use to gather symbol information used by code search features. You can choose to use indexers in the project properties for each project under the C/C++ Indexer heading. It is also available in the Preferences dialog, which sets the default indexer for new projects and can also be used to apply that indexer selection to all projects in the workspace. There are three choices for indexing: no indexer, fast indexer, and full indexer. No indexer implies that no indexing takes place, and as a result, the search features will not function. The full indexer does a full parse of the workspace and provides the most accurate information, and it is similar to what was provided in version 6.3.0 SP2. The fast indexer uses heuristics to optimize the parse and is the recommended selection for large projects.
We recommend that you use the fast indexer option. The fast indexer takes a fraction (approximately 10-25%) of the time to index a large project than in IDE version 6.3.0 SP2. It also successfully indexes extremely large projects.
For example, the fast indexer can index the Firefox browser source in approximately 14 minutes. There are approximately 5600 indexable files (source and header files) with over 300,000 symbols.
Debugger
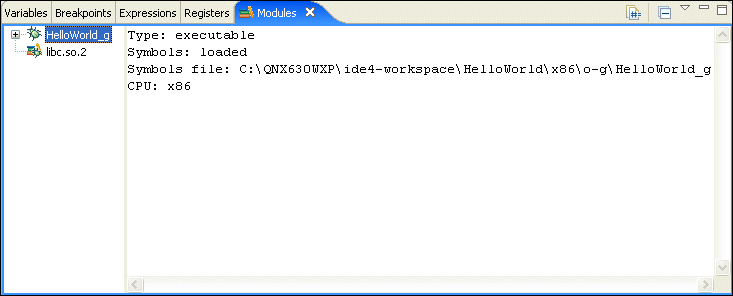
- A new Modules view
- All of the binary components, or modules, are now displayed in the
debugger's Modules view. This includes DLLs, shared objects and
application binaries themselves. Additionally, each module can be
expanded, letting you put breakpoints directly on binary
components without opening the C/C++ Project view.
- Memory view
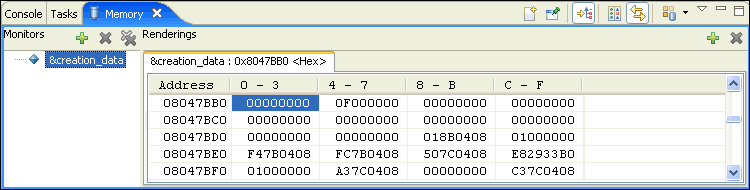
- The debugger now uses the standard platform Memory view,
allowing for a number of format translations and multiple memory
location inspection.
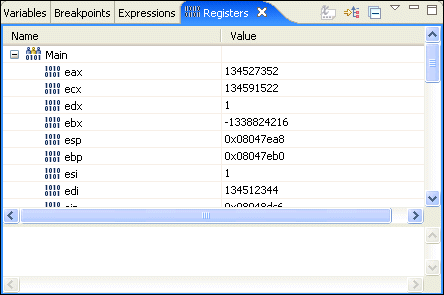
- Register groups
- The Registers view now supports the concept of register groups,
so you can define the collection of registers relevant
to your particular debugging environment.
QNX Momentics workbench
- Significant performance enhancements
- For detailed information about the performance enhancements throughout the workbench for Eclipse, see the "What's New" topic in the online help for the Workbench Users Guide.
Debugging
- Console EOF
- In the Console view, you can signal end-of-file to a program waiting for input; for Windows, press Ctrl-Z, and for Linux, Neutrino, and Solaris, press Ctrl-D.
- Console encoding
- You can configure the console to display output using a character encoding different from the default encoding. To set the console encoding for an application, use the Console Encoding settings on the Common tab of a launch configuration.
- Capturing program output
- You can now configure a program's output in a file in addition to writing it to the console. The behavior is controlled by settings found on the Common tab of launch configurations.
- Multiple console views
- If you need to view multiple consoles at the same time, you can open additional Console views using the New Console View command located on the Open Console drop-down menu in the Console view.
What was new in the IDE in 6.3.0 SP3?
Service Pack 3 includes all of the bug fixes and updates found in the previous service packs. The development environment is the same as the one introduced with Service Pack 2.
What was new in the IDE in 6.3.0 SP2?
The following sections describe some of the more interesting or significant changes made to the IDE in QNX Momentics 6.3.0 SP2:
- General IDE
- C/C++ user interface
- C/C++ debug and launch
- C/C++ project configuration and build
- C/C++ editing and source navigation
- QNX Momentics tools
General IDE
The QNX Momentics 6.3.0 SP2 IDE sports many useful new features:
- New look and feel
- Responsive UI
- Editor management enhancements
- Themes
- Background workspace auto-refresh
- Regular expressions in Find/Replace dialog
- New text editor functions
- New editor functions
- Opening external files
New look and feel
The look and feel of the workbench has evolved. Here are some of the things you might notice:
- Title bars and tabs for views and editors look different.
- Title bars and tabs for views and editors let you maximize and restore.
- Views include a button for collapsing (minimizing).
- Perspective switching/opening toolbar support has
changed:
- You can dock it on the top right (default), top left, or left.
- Perspective buttons include text for quickly identifying the current perspective.
- The Fast View bar can be on the bottom (default), left, or right.
- The size of the Fast View bar is reduced when there are no fast views.
- Title bars and tabs were merged to conserve space.
- Drag-and-drop has been improved.
- Detached views are supported (Windows and Linux GTK only, due to platform limitations).
- Editor management has changed.
- The view-specific toolbars are now next to the view's tab, to save space when possible.
- Different tab folder styles and uses of color have been employed to help indicate active and selected views and editors more clearly.
- Other minor items such as status bar style, border widths, shading, etc.
Responsive UI
A number of changes have occurred in the UI to support a higher level of responsiveness. This includes support for running jobs in the background instead of tying up the UI and making you wait.
The IDE now features a:
- Progress view
- status line entry showing what's running in the background
- dialog for showing operations that can be run in the background
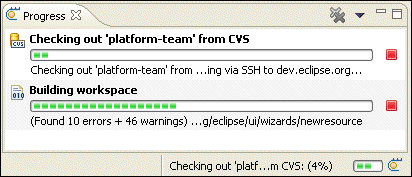
The new Progress view, showing the progress of a CVS checkout and a Workspace build background operation.
Many user operations can now be run in the background. When you see the progress dialog with the Run In Background button, you can click it to immediately return to your work.
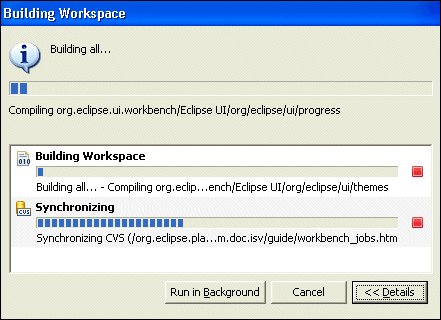
This dialog also shows you the details of other currently running operations in the workspace and informs you when one operation is blocked and waiting for another to complete.
Editor management enhancements
A number of changes and enhancements have gone into the editor management in the QNX Momentics IDE.
The IDE now provides:
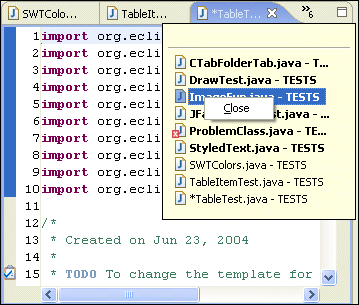
- support for single and multiple editor tabs; single is especially useful for those who tend to have many files open or who like using the keyboard to navigate editors
- support for editor pinning. When limiting the number of editors that can be opened at once, some editors that should not be closed can be pinned. An indicator is displayed when an editor is pinned.
- chevrons to handle the overflow of editors with an extra indication of how many more editors are open than there are tabs on the screen.
- new menu options, keyboard shortcuts, and key bindings
for editor management:
- Close Others -- close all editors but the current.
- Close All -- menu option available.
- Ctrl+E -- drop-down list of editors supports type-ahead.
Themes
The QNX Momentics IDE contains basic support for themes to allow for the customization of colors and fonts used in the workbench.
Background workspace auto-refresh
Changes made in the local filesystem can now be automatically refreshed in the workspace. This automatic refresh saves you from having to do a manual every time you modify files with an external editor or tool. This feature is currently disabled by default, but can deactivated from the Workbench preference page.
Regular expressions in Find/Replace dialog
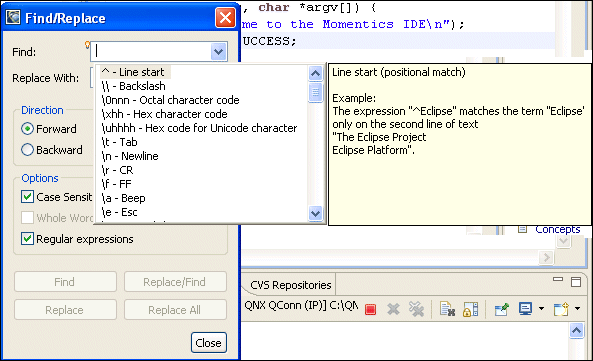
The Find/Replace dialog for text editors supports searching and replacing using regular expressions. Press F1 to get an overview of the regular expression syntax, and press Ctrl-Space to get Content Assist for inserting regular expression constructs.
When the cursor is placed in a dialog field that can provide Content Assist, a small light bulb appears at the upper-left corner of the field.
New text editor functions
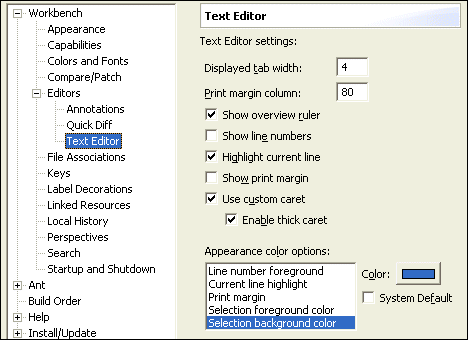
You can customize the displayed width of tabs and the text selection foreground and background colors in the text editor. See the page:
New editor functions
All text editors based on the QNX Momentics IDE editor framework support new editing functions, including moving lines up or down (Alt-Up Arrow and Alt-Down Arrow), copying lines (Ctrl-Alt-Up Arrow and Ctrl-Alt-Down Arrow), inserting new a line above or below the current line (Ctrl-Shift-Enter and Shift-Enter), and converting to lowercase or uppercase (Ctrl-Shift-Y and Ctrl-Shift-X).
Double-clicking on the line number in the status line is the same as (Ctrl-L).
Opening external files
The File menu now includes an Open External File... option that lets you open any file in the workbench without having to import it into a project.
C/C++ user interface
The new CDT in the QNX Momentics 6.3.0 SP2 IDE features:
- Outline filters and groups
- New wizard for creating C++ classes
- New wizards for working with C/C++
- Code folding
- Makefile editor
Outline filters and groups
The Outline view now offers you the ability to filter out certain elements such as defines and namespaces as well as the ability to group all include statements together.
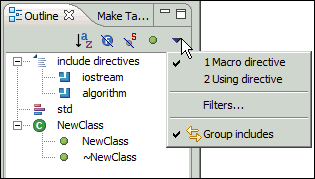
New C++ Class wizard
Creating new C++ classes continues to get easier with a number of enhancements to the C++ class-creation wizard.
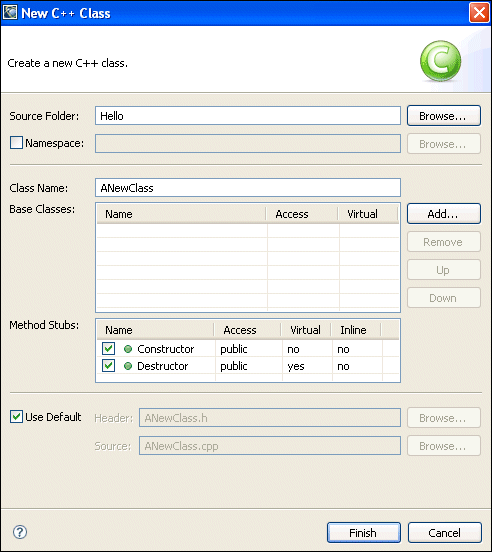
New C/C++ wizards
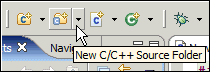
A new toolbar has been created that facilitates the creation of a number of standard C/C++ objects:
- source and header files
- source folders
- C and C++ projects
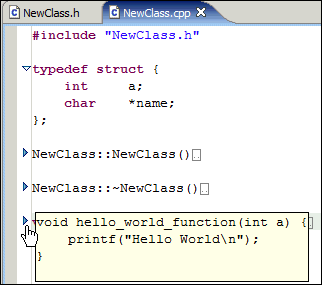
Code folding
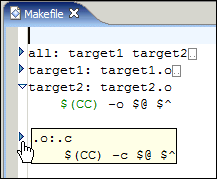
The C/C++ editor supports code folding for functions, methods, classes, structures and macros.
Makefile editor
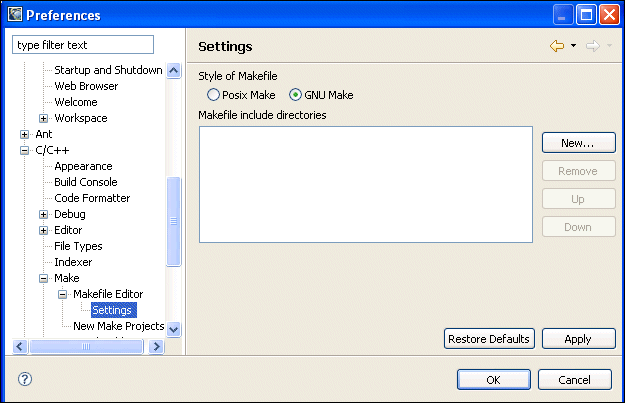
The Makefile editor has a new Preferences dialog and supports code folding.
C/C++ debug and launch
Debugging support and application launching in the CDT has been improved, as described in the following sections:
- Thread-specific breakpoints
- Breakpoint filtering
- Workspace variable support
- Mixed source/assembly
- Global variables
- Debug console
- Automatic refresh options
- Detailed Launch configurations
Thread-specific breakpoints
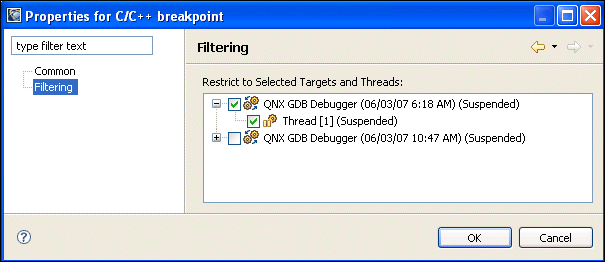
The C/C++ Debugger now supports thread-specific breakpoints. After placing a breakpoint, look at its Properties to see which threads or processes it's active for.
Breakpoint filtering
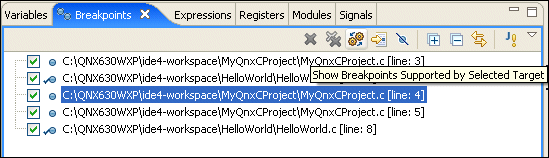
The Breakpoints view now lets you filter out all of the irrelevant breakpoints based on the specific process that you're debugging.
Workspace variable support
C/C++ launch configurations now include support for workspace variables in the Environment, Argument, and Working Directory tabs.
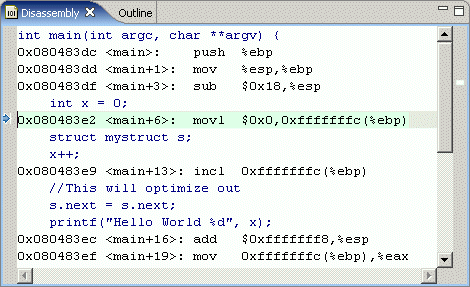
Mixed source/assembly
You no longer have to toggle the C/C++ editor to show the assembly of a program. Instead, use the Disassembly view to see both assembly code and source mixed:
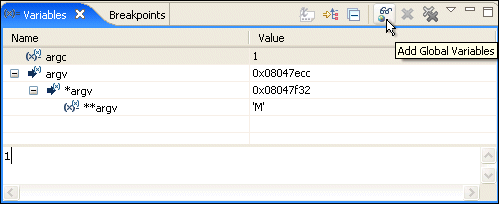
Global variables
You can add global variables to the Variables view instead of having to add them as separate expressions.
Debug console
The Debug Console has moved to being a proper console selection of its own in the generic Console view.

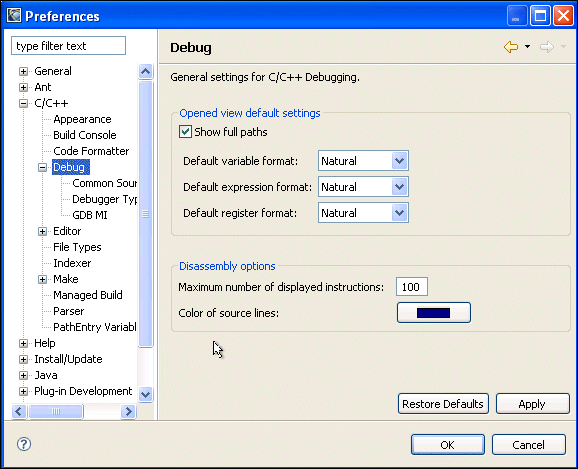
Automatic refresh options
You can now configure the default behavior for the automatic retrieval of shared library and register information in the C/C++ debugger.
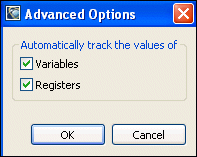
You can specify whether to refresh register values automatically or manually from the Launch configuration dialog with the Advanced button of the Debug tab.
Detailed Launch configurations
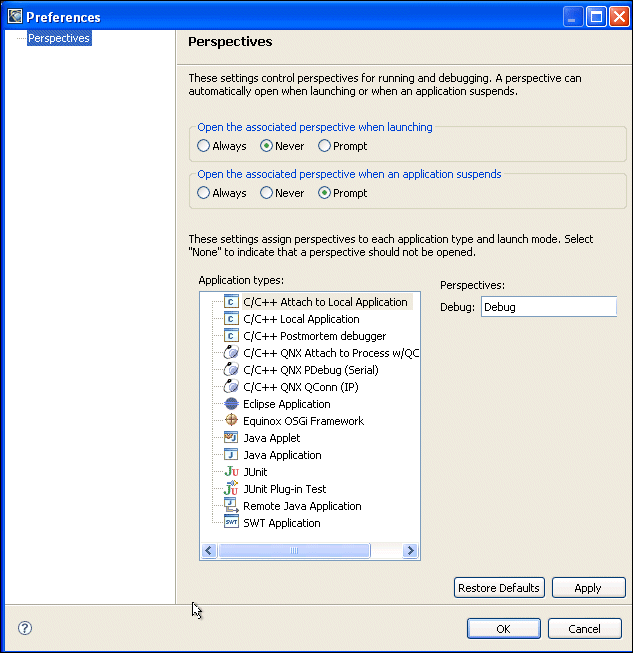
You can now maintain separate Run and Debug launch configurations for debugging core files, attaching to a running process, attaching to your target with pdebug (serial debugging), and attaching to your target with qconn (TCP/IP debugging).
C/C++ project configuration and build
Project configuration and building has been improved:
- Automatic project settings discovery
- Include paths and symbols
- Source folders
- C/C++ file types
- C/C++ working set
Automatic project settings discovery
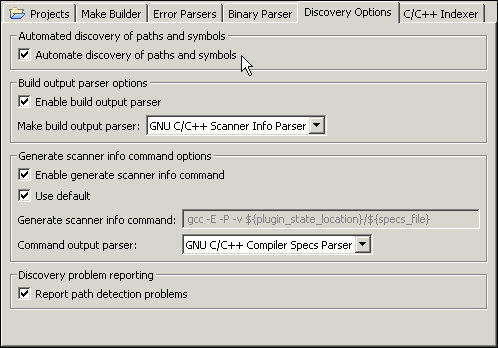
Automatically generate project defines and include path settings from the C/C++ Standard Make project's Discovery Options project settings.
|
This is for projects being built with one of the platform-specific nto*-gcc drivers and a custom Makefile. |
Include paths & symbols
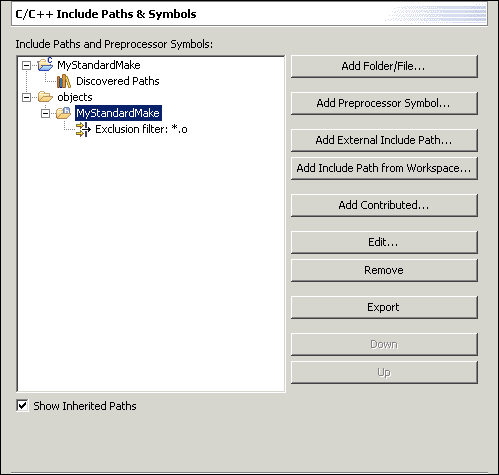
Use the C/C++ Include Paths and Symbols to set up the project settings appropriately for searching, indexing, and other source navigation functionality.
Source folders
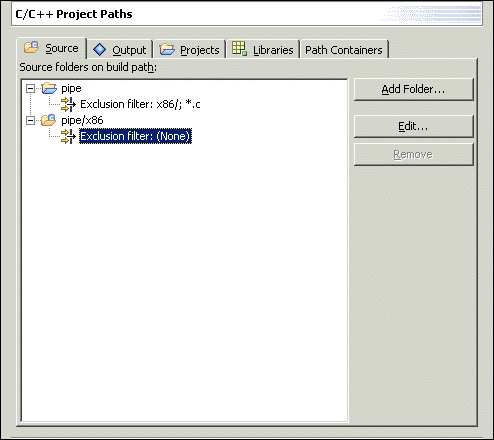
Use the C/C++ Project Paths project properties to determine those files and directories that should be specifically considered as containing source, output, or library content. You can improve performance by limiting the directories and files of large projects.
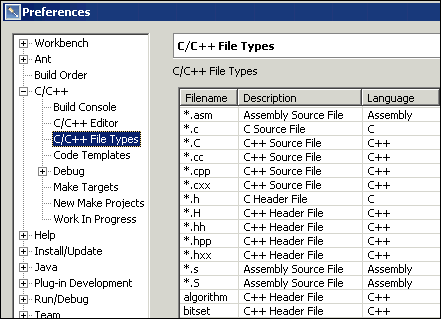
C/C++ file types
Define the types of specific files, especially C++ headers without extensions, using the C/C++ File Types global preference or project property.
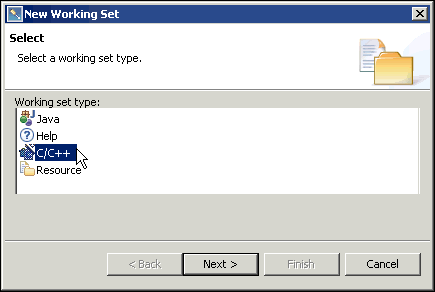
C/C++ working set
You can now create working sets containing only C/C++ projects and resources by creating a C/C++ Working Set definition.
C/C++ editing and source navigation
Editing and navigating your C/C++ source files is now easier with:
- C/C++ content assist
- Rename refactoring
- Open type
- C/C++ Browsing perspective
- Makefile editor
- Search enhancements
- Hyperlink navigation
- Index error markers
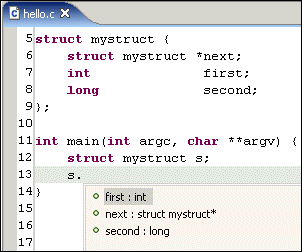
C/C++ content assist
Editing code is easier with a more fully featured content assist feature. Completions are provided in the C/C++ editor for:
- classes and structure members
- local and global variables
- functions
- preprocessor defines
- preprocessor commands
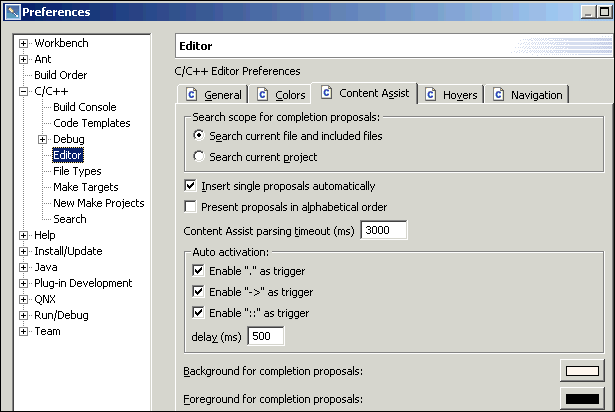
Configure completion options in the global C/C++ Editor Preferences.
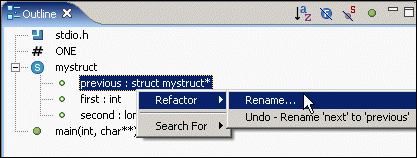
Rename refactoring
Use the Outline view or the C/C++ editor's context menu to refactor class and type names, methods, functions, and member names.
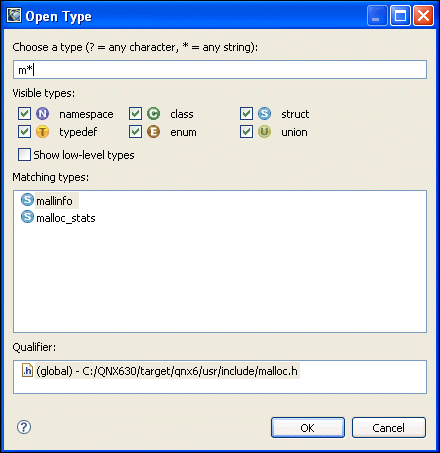
Open type
Use (Ctrl-Shift-T) to open the declaration of C/C++ classes, structures, unions, typedefs, enumerations, and namespaces.
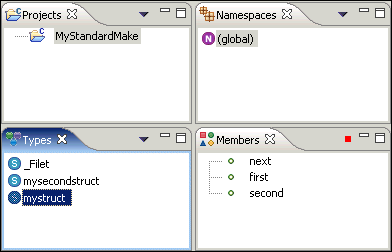
C/C++ Browsing perspective
Use the C/C++ Browsing perspective to navigate the class and structure members of a particular project.
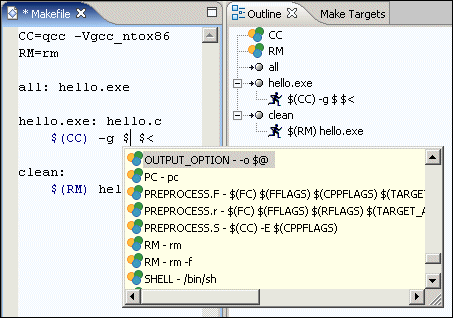
Makefile editor
The Makefile editor now provides syntax highlighting, code completion, and content outlining capabilities.
Search enhancements
The C/C++ Search dialog provides context-sensitive searches from the Outline view as well as resource selection-restricted searches in the C/C++ Search dialog.
Hyperlink navigation
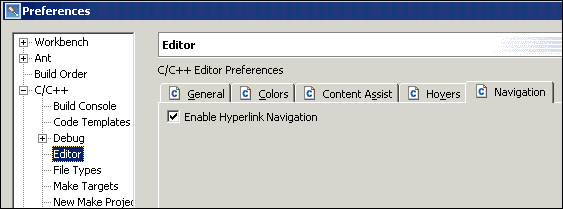
The C/C++ Editor supports hyperlink navigation, if enabled, by selecting . Then you can use Ctrl-Click to move to the declaration of an item directly in the C/C++ editor.
Index error markers
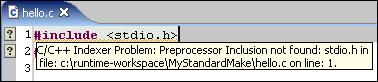
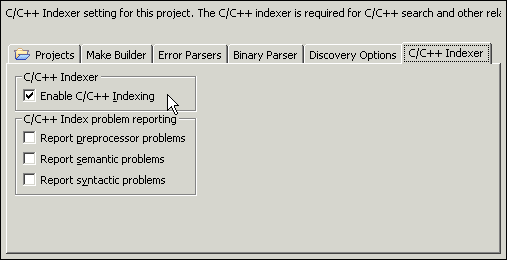
Enable C/C++ indexing and indexer error reporting in the C/C++ Indexer properties. This helps identify projects that are missing path-configuration information.
Configure the indexer from the C/C++ Indexer project settings:
QNX Momentics tools
These exclusive QNX Momentics tools have also been updated and improved:
Memory Analysis
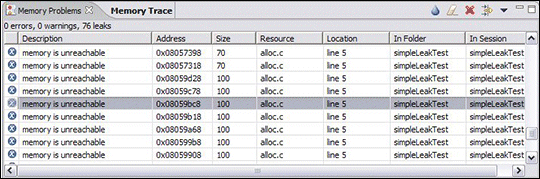
The following new features have been added to the Memory Analysis perspective:
- streamlined user interface
- support for memory leak detection in real time and when a program exits
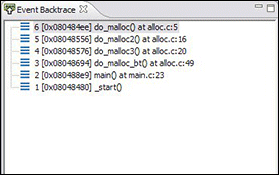
- deeper, configurable, backtrace information, configured
separately for allocation tracing and error detection
- timestamp tracking of allocations and errors
- thread tracking of allocations and errors
- an optional command-line interface
- the ability to dump trace information to a file
- external runtime control (start, stop for tracing and leak detection)
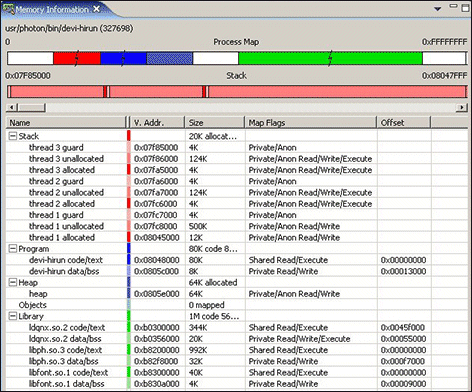
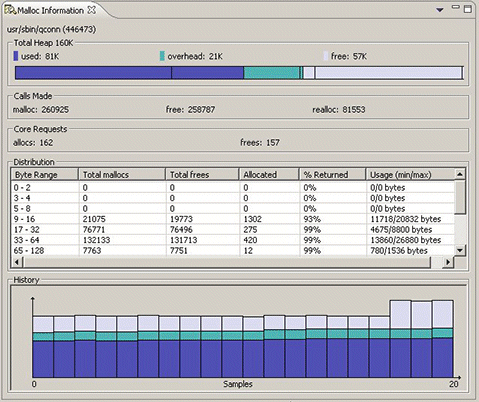
The Memory Information and Malloc Information views are now part of the System Information perspective.
System Profiler
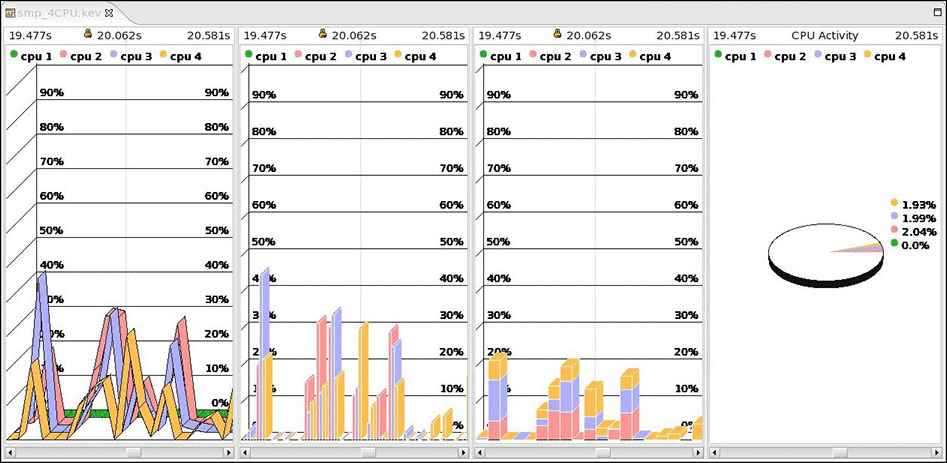
The new features added to the System Profiler in 6.3.0 SP2 are:
- new interrupt handler element, with its own timeline, CPU usage, and calling process
- CPU usage and process activity for threads takes into account the time spent in interrupts
- several new graph types including 3D perspectives:
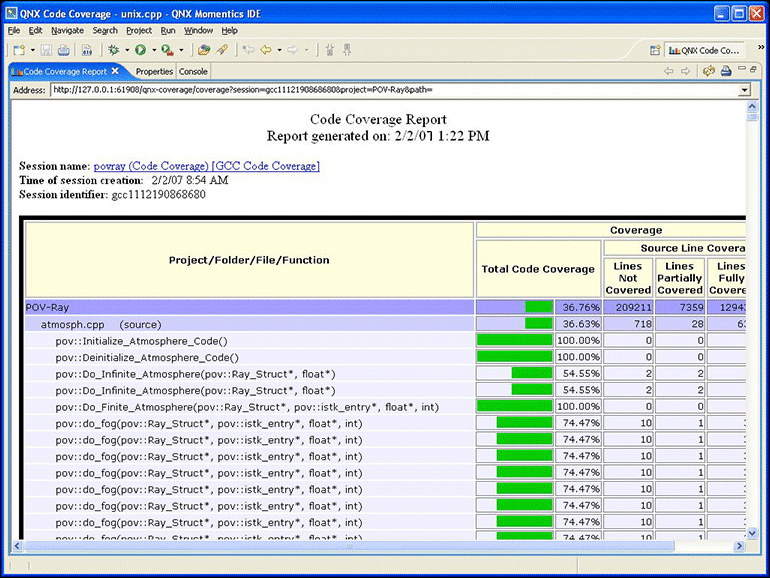
Code Coverage
Improved reporting output and export capabilities.
System Information
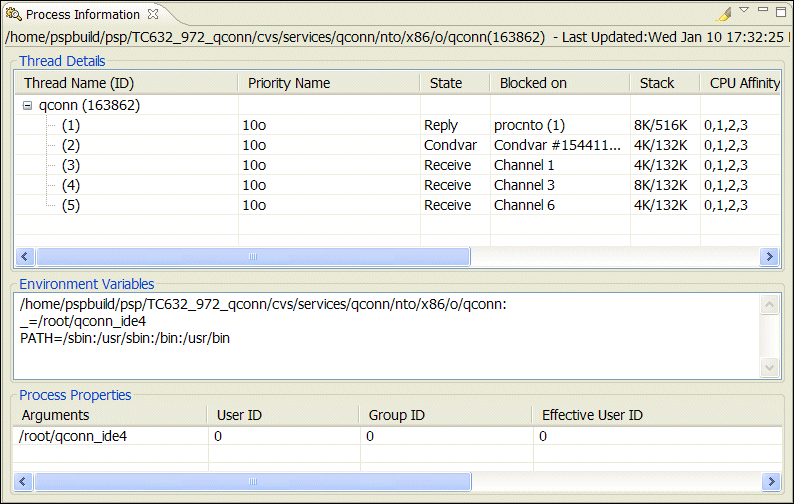
The System Information perspective has been rewritten with a new update control mechanism, and simplified Process Information and Signal Information views.
The new Process Information view:
The new Signal Information view:
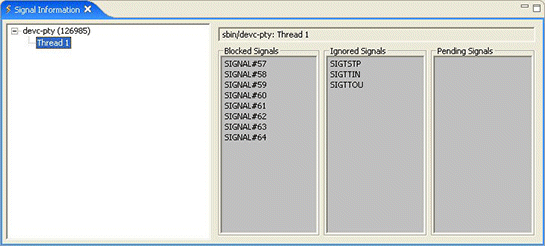
The Memory Information and Malloc Information views (formerly found in the Memory Analysis perspective) are now part of the System Information perspective.
System Builder
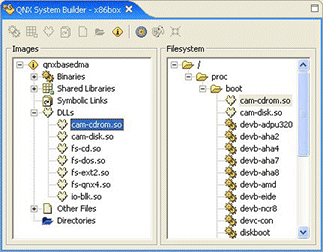
The following new features have been added to the System Builder perspective:
- You can create projects with multiple IFS images. You can combine an IFS with one or more EFS images while building the project.
- There are more ways to add a filesystem image to the existing project.
- You can build each IFS or EFS component separately.
- You can combine images as a separate step. You can define images to combine at that point, and you can dynamically change the combination parameters for each component.
- The System Builder displays the filesystem layout for each IFS or EFS image.
- The System Optimization component is more flexible.
What was new in the IDE in 6.3.0 SP1?
Here are some of the more interesting or significant changes made to the QNX Momentics IDE in QNX Momentics 6.3.0:
- System Profiler
- improved scalability and performance
- improved graphic timeline display for events
- additional filters: state activity, IPC activity, and CPU usage
- Improved documentation, including more extensive code importing procedures, etc.
- The System Builder perspective now supports projects with more than one buildfile, and the perspective's icons have been improved.
- The Application Profiler, System Builder, System Information, and System Profiler perspectives have been improved.
- The stability and usability of the self-hosted IDE have been improved.
- New Support for Intel's C compiler (icc).
- The Code Coverage perspective now works with gcc 3.3.1 or later.
|
|
|
|