PtMTrend
![[Previous]](prev.gif) |
![[Contents]](contents.gif) |
![[Index]](keyword_index.gif) |
![[Next]](next.gif) |
PtMTrend
A medical trend widget
Class hierarchy:
PtWidget --> PtBasic --> PtMTrend
PhAB icon:

Public header:
<photon/PtMTrend.h>
Description:
A PtMTrend widget displays trend graphs intended for medical applications. The data is displayed as a set of connected points that shift in a specified direction and at the rate at which data is fed in, or at a rate specified by the application.
PtMTrend is similar to PtTrend, but with some added capabilities:
- A trace mode that displays a trace line, indicating where new data is being drawn.
- Each graph has its own minimum and maximum values.
- Customizable line thickness and join type for each graph.
- You can provide your own customized functions for drawing graphs, the grid, and the trace line.
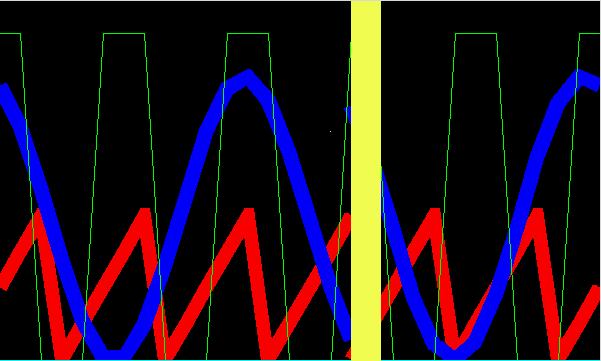
A PtMTrend widget.
New resources:
| Resource | C type | Pt type | Default |
|---|---|---|---|
| Pt_ARG_MTREND_FLAGS | int | Flag | Pt_MTREND_ALWAYS_SCROLL |
| Pt_ARG_MTREND_N_SAMPLES | unsigned | Scalar | 0 |
| Pt_ARG_MTREND_N_GRAPHS | unsigned | Scalar | 0 |
| Pt_ARG_MTREND_GRAPH_ATTR | PtMTrendAttr_t | Struct | N/A |
| Pt_ARG_MTREND_GRAPH_STATE | int | Scalar | N/A |
| Pt_ARG_MTREND_GRAPH_DATA | PtMTrendData_t | Struct | N/A |
| Pt_ARG_MTREND_TRACE_WIDTH | int | Scalar | 5 |
| Pt_ARG_MTREND_TRACE_COLOR | PgColor_t | Scalar | 0xC0C0C0 |
| Pt_ARG_MTREND_TRACE_DRAW_F | See below | pointer | N/A |
| Pt_ARG_MTREND_GRID_X | unsigned | Scalar | 5 |
| Pt_ARG_MTREND_GRID_Y | unsigned | Scalar | 5 |
| Pt_ARG_MTREND_GRID_COLOR | PgColor_t | Scalar | 0xC0C0C0 |
| Pt_ARG_MTREND_GRID_DRAW_F | See below | pointer | N/A |
| Pt_ARG_MTREND_ADVANCE_BY_N_SAMPLES | unsigned | Scalar | 1 |
Pt_ARG_MTREND_FLAGS
| C type | Pt type | Default |
|---|---|---|
| int | Flag | 0 |
Flags that control the way the widget draws data.
Direction flags; one of:
- Pt_MTREND_HORZ_L2R
- Draw the trend left to right.
- Pt_MTREND_HORZ_R2L
- Draw the trend right to left.
- Pt_MTREND_VERT_T2B
- Draw the trend top to bottom.
- Pt_MTREND_VERT_B2T
- Draw the trend bottom to top.
When setting the direction flag, use Pt_MTREND_DIRECTION_MASK as the len argument for the PtSetArg() or PtSetResource() function.
Grid flags; one of:
- Pt_MTREND_GRID_NONE
- Do not show a grid.
- Pt_MTREND_GRID_ABOVE
- Draw the grid over the graphs.
- Pt_MTREND_GRID_BELOW
- Draw the grid under the graphs.
To set the grid, use Pt_MTREND_GRID_MASK as the len argument for the PtSetArg() or PtSetResource() function.
Graphs drawing mode; one of:
- Pt_MTREND_TRACE
- Draw a trace line indicating where new graph data is being drawn on the trend.
- Pt_MTREND_BLIT
- Use blit mode -- blit the data to reduce CPU use. Blit mode is available only if Pt_MTREND_TRACE isn't set and no grid is shown.
- Pt_MTREND_ALWAYS_SCROLL
- When data is first drawn on an empty graph, start drawing
from the side of the graph that represents the newest data. The
side that represents new data is dependent on the direction flag.
For example, if the direction is Pt_MTREND_HORZ_L2R,
new data is drawn on the right hand side of the graph, and older
data is scrolled to the left.
If this flag is not set, when data is first drawn in the graph, it is drawn on the side that represents old data. Once the graph fills with data, it begins to scroll in the direction indicated by the direction flag.
Pt_ARG_MTREND_N_SAMPLES
| C type | Pt type | Default |
|---|---|---|
| unsigned | Scalar | 0 |
The maximum number of samples shown in the trend. If you reduce this number when there is sample data in the trend, the oldest samples are trimmed.
Pt_ARG_MTREND_N_GRAPHS
| C type | Pt type | Default |
|---|---|---|
| unsigned | Scalar | 0 |
The number of graphs drawn in the trend. Note that graphs are numbered starting at 0, but this resource indicates the actual number of graphs.
If you add new graphs to a trend widget, they appear with minimum values until you set the graph data. If you reduce the number of graphs, existing graphs are removed from the trend. For example, if you have 5 graphs numbered 0 to 4 in your trend, and you change Pt_ARG_MTREND_N_GRAPHS from 5 to 3, graphs 3 and 4 are removed from the trend.
Pt_ARG_MTREND_GRAPH_ATTR
| C type | Pt type | Default |
|---|---|---|
| PtMTrendAttr_t | Struct | N/A |
Set attributes of a graph. PtMTrendAttr_t contains the following members, which your application must fill in:
- int state
- The trend state; one of Pt_MTREND_STATE_SHOWN (visible) or Pt_MTREND_STATE_HIDDEN (not visible).
- PgColor_t color
- The line color.
- int line_thickness
- The line thickness, in pixels.
- int join_type
- The line join type; see PgSetStrokeJoin() in the Photon Library Reference for more information about join types.
- int min and max
- The minimum and maximum values for sample data.
- void *draw_f
- A pointer to a customized draw function for the graph. You can set the pointer to your own function (see below).
To set your graph draw function, draw_f should be a pointer of type:
void (*draw_f)( PtWidget_t *widget,
                PhTile_t *damage,
                struct pt_mtrend_graph_info *attr );
The widget argument is a pointer to the trend widget of type PtMTrend. The damage argument is the damage list for the widget. The attr argument is type pt_mtrend_graph_info, which has at least the following attributes:
- PtMTrendAttr_t attr
- A structure containing the attribute information for the graph.
- int n_samples
- The total number of samples in the data buffer.
- int *data
- A pointer to an array of data for the graph, with the oldest data at position 0.
When setting this resource with PtSetArg() or PtSetResource(), pass the graph number as the len argument.
Pt_ARG_MTREND_GRAPH_STATE
| C type | Pt type | Default |
|---|---|---|
| int | Scalar | N/A |
Enables or disables graph drawing. Values:
- Pt_MTREND_STATE_SHOWN
- Draw the graph.
- Pt_MTREND_STATE_HIDDEN
- Don't draw the graph.
When setting this resource with PtSetArg() or PtSetResource(), pass the graph number as the len argument.
Pt_ARG_MTREND_GRAPH_DATA
| C type | Pt type | Default |
|---|---|---|
| PtMTrendData_t | Struct | N/A |
Use to add or change data for a specified graph. When setting this resource with PtSetArg() or PtSetResource(), pass the graph number as the len argument. The PtMTrendData_t contains at least these members:
- int mode
- Can be one of Pt_MTREND_ADD or Pt_MTREND_PUT
- unsigned n_samples
- The number of data samples in the data array.
- unsigned last_sample
- The sample number where to put new data into the buffer, if mode is Pt_MTREND_PUT.
- const int *data
- The data samples array.
For convenience, the library provides PtMTrendAddData() and PtMTrendChangeData() for working with data in the graphs.
Pt_ARG_MTREND_TRACE_WIDTH
| C type | Pt type | Default |
|---|---|---|
| int | Scalar | 5 |
The width of the trace strip. If positive, this is the number of pixels. If negative, the width is calculated as the absolute value of this resource multiplied by the width of one data sample.
Pt_ARG_MTREND_TRACE_COLOR
| C type | Pt type | Default |
|---|---|---|
| PgColor_t | Scalar | 0xC0C0C0 |
The trace strip color.
Pt_ARG_MTREND_TRACE_DRAW_F
| C type | Pt type | Default |
|---|---|---|
| See below | Pointer | N/A |
By default, a pointer to the default trace drawing function. You can provide your own drawing function for the trace line by setting this resource to a pointer with the following type:
void (*draw_f)( PtWidget_t *widget, PhTile_t *damage );
The arguments are:
- widget
- A pointer to a PtMTrendWidget_t structure. The function should use the trace.pos and trace.dim members of this structure for drawing.
- damage
- The damage list for the draw function.
Pt_ARG_MTREND_GRID_X
| C type | Pt type | Default |
|---|---|---|
| unsigned | Scalar | 5 |
The number of vertical grid lines, if the grid is turned on.
Pt_ARG_MTREND_GRID_Y
| C type | Pt type | Default |
|---|---|---|
| unsigned | Scalar | 5 |
The number of horizontal grid lines, if the grid is turned on.
Pt_ARG_MTREND_GRID_COLOR
| C type | Pt type | Default |
|---|---|---|
| PgColor_t | Scalar | 0xC0C0C0 |
The grid line color, if the grid is turned on.
Pt_ARG_MTREND_GRID_DRAW_F
| C type | Pt type | Default |
|---|---|---|
| See below | Pointer | N/A |
A pointer to the default grid drawing function. You can provide your own customized grid drawing function by setting this resource to a pointer to a function of the following type:
void (*draw_f)( PtWidget_t *widget, PhTile_t *damage );
The arguments are:
- widget
- A pointer to a PtMTrendWidget_t structure. The function should use the grid.* members for drawing.
- damage
- The damage list for the widget.
Pt_ARG_MTREND_ADVANCE_BY_N_SAMPLES
| C type | Pt type | Default |
|---|---|---|
| unsigned | Scalar | 1 |
This resource specifies the number of data samples to be shifted when the limit (the edge of the trend widget) is reached. If set to 1 (default), the trend appears to be continuously scrolling. That is, for each draw cycle, the trend is scrolled by one sample, then the new sample is drawn.
If you set this resource to a larger value, the trend scroll behavior is different. For example, if you set the value to 10, each time the trend reaches the end of the widget, the trend is scrolled back by ten samples. Ten more samples are drawn before the trend is scrolled again.
You can set this resource to a value larger than 1 only for trends that aren't in trace mode.
Inherited resources:
If the widget modifies an inherited resource, the "Default override" column indicates the new value. This modification affects any subclasses of the widget.
Convenience functions:
The PtMTrend defines the following convenience functions that make it easier to use the widget once it's been created:
- PtMTrendAddData()
- Add data to a trend.
- PtMTrendChangeData()
- Change existing data in a trend.
|
|
|
|