Analyzing Your System with Kernel Tracing
![[Previous]](prev.gif) |
![[Contents]](contents.gif) |
![[Index]](keyword_index.gif) |
![[Next]](next.gif) |
Analyzing Your System with Kernel Tracing
You can select a topic from this diagram:
Use the System Profiler to analyze your system via instrumentation.
In this chapter:
- Introducing the QNX System Profiler
- Configuring a target for system profiling
- Capturing instrumentation data in event log files
- Viewing and interpreting the captured data
- Filtering a profile
- System Profiler use cases
- Associated views
- System Profiler editor
- Bookmarks view
- Client/Server CPU Statistics view
- Condition Statistics view
- CPU Migration pane
- Event Owner Statistics view
- General Statistics view
- Raw Event Data pane
- Overview view
- Partition Summary pane
- Thread State Snapshot pane
- Timeline State Colors pane
- Trace Event Log view
- Why Running? pane
Introducing the QNX System Profiler
The System Profiler is a tool that works in concert with the Neutrino instrumented kernel (procnto-instr) to provide insight into the operating system's events and activities. Think of the System Profiler as a system-level software logic analyzer. Like the Application Profiler, the System Profiler can help pinpoint areas that need improvement, but at a system-wide level.
The instrumented kernel can gather a variety of events, including:
- kernel calls
- process manager activities
- interrupts
- scheduler changes
- context switches
- user-defined trace data
You might use the System Profiler to solve such problems as:
- IPC bottlenecks (by observing the flow of messages among threads)
- resource contention (by watching threads as they change states)
- cache coherency in a multicore machine (by watching threads as they migrate from one CPU or core to another)
 |
Details on kernel instrumentation (such as types and classes of events) are more fully covered in the System Analysis Toolkit (SAT) User's Guide. |
The QNX System Profiler perspective includes several components that are relevant to system profiling:
- Navigator view
- Events are stored in log files (with the extension .kev) within projects in your workspace. These log files are associated with the System Profiler editor.
- Target Navigator view
- When you right-click a target machine in the Target Navigator view, you can select , which initiates the Log Configuration dialog. You use this wizard to specify which events to capture, the duration of the capture period, as well as specific details about where the generated event log file (.kev file) is stored.
- System Profiler editor
- This editor provides the graphical representation of the instrumentation events in the captured log file. Like all other Eclipse editors, the System Profiler editor shows up in the editor area and can be brought into any perspective. This editor is automatically associated with .kev files, but if you have other file types that contain instrumentation data, you could associate the editor with those files as well.
- Trace Event Log view
- This view lists instrumentation events, as well as their details (time, owner, etc.), surrounding the selected position in the currently active System Profiler editor.
- General Statistics view
- A tabular statistical representation of events.
You can gather statistics for the entire log file or for a selected range. - Condition Statistics view
- A tabular or graphical statistical representation of the conditions used in the search panel.
- Event Owner Statistics view
- A tabular statistical representation of events broken down per owner.
Other components help you determine why a given thread is running, examine the migration of threads from one processor or core to another, and so on. For more details, see "Associated views," later in this chapter.
|
The QNX System Profiler perspective may produce incorrect results when more than one IDE is communicating with the same target system. To use this perspective, make sure only one IDE is connected to the target system. |
Before you begin
As mentioned earlier, to capture instrumentation data for analysis, the instrumented kernel (procnto-instr) must be running. This kernel is a drop-in replacement for the standard kernel (though the instrumented kernel is slightly larger). When you're not gathering instrumentation data, the instrumented kernel is almost exactly as fast as the regular kernel.
|
To determine if the instrumented kernel is running, enter this
command:
ls /proc/boot If procnto-instr appears in the output, then the OS image is running the instrumented kernel. |
To substitute the procnto-instr module in the OS image on your board, you can either manually edit your buildfile, then run mkifs to generate a new image, or use the System Builder perspective to configure the image's properties.
Replacing the kernel using the System Builder
- In the System Builder Projects view, double-click the project.bld file for the image you want to change.
- In the Images pane of the System Builder editor, select the image.
- In the Properties view, click the Procnto field
(under System). A dropdown-menu button appears in
the field:
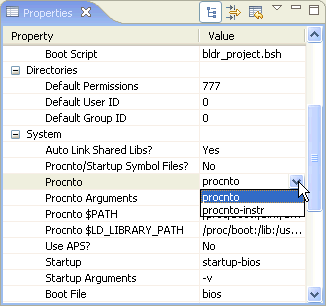
- Select procnto-instr, press Enter, then save your change.
- Rebuild your project, then transfer your new OS image to your board.
Assuming you're running the instrumented kernel on your board, you're ready to use the System Profiler. A profiling session usually involves these three steps:
- configuring a target for system profiling
- capturing instrumentation data in event log files
- viewing and interpreting the captured data
Configuring a target for system profiling
You can gather trace events from the instrumented kernel in two different ways. You can run a command-line utility (e.g. tracelogger) on your target to generate a log file, and then transfer that log file back to your development environment for analysis. Or, you can capture events directly from the IDE using the Log Configuration dialog.
|
In order to get timing information from the kernel, you need
to run tracelogger as the root user.
If you gather system-profiling data through qconn in the IDE, you're already accessing the instrumented kernel as root. |
Using the command-line server currently offers more flexibility as to when the data is captured, but requires that you set up and configure filters yourself using the TraceEvent() API. The Log Configuration dialog lets you set a variety of different static filters and configure the duration of time that the events are logged for.
For more information on the tracelogger utility, see its entry in the Utilities Reference. For TraceEvent(), see the Neutrino Library Reference.
Launching the Log Configuration dialog
- To launch the Log Configuration dialog:
- In the Target Navigator view, right-click a target, then select from the menu. If you don't have the Target Navigator view open, choose , then .
|
If you don't already have a target project, you'll have to create one. To create a target project:
You can use this target project for a number of different tasks (debugging, memory analysis, profiling), so once you create it, you won't have to worry about connecting to your target again. Note also that the qconn target agent must be running on your target machine. |
Selecting options in the wizard
The Log Configuration dialog takes you through the process of selecting:
- the location of the captured log file (both on the target temporarily and on the host in your workspace)
- the duration of the event capture
- the size of the kernel buffers
- the number of qconn buffers
- the event-capture filters (to control which events are captured)
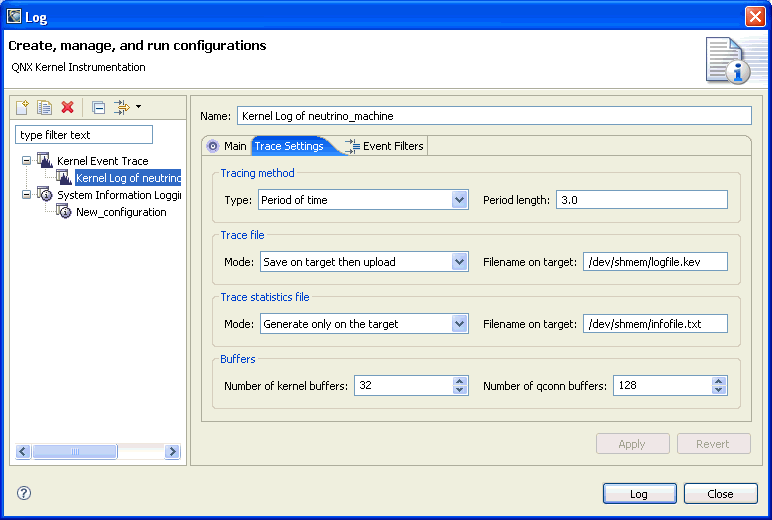
Here are the main fields in this wizard:
- Tracing method, Type (Period of time)
- The duration of the capture of events as defined by a time. This is the default.
- Tracing method, Period length
- A floating-point value in seconds representing the length of time to capture kernel events on the target.
- Tracing method, Type (Iterations)
- The duration of the capture of events as defined by the number of kernel event buffers.
- Tracing method, Number of Iterations
- Total number of full kernel event buffers to log on the target.
- Trace file, Mode (Save on target then upload)
- In this mode, kernel event buffers are first saved in a file on the target, then uploaded to your workspace. This is the default.
- Trace file, Filename on target
- Name of the file used to save the kernel event buffers on the target.
- Trace file, Mode (Stream)
- In this mode, no file is saved on the target. Kernel event buffers are directly sent from qconn to the IDE.
- Trace statistics File, Mode (Generate only on the target)
- The information file is generated only on the target. This is the default.
- Trace statistics file, Mode (Do not generate)
- No file is generated.
If your target is running QNX Neutrino 6.2.1, you must use this option instead of "Generate only on the target" because the trace statistics file is not supported under QNX Neutrino 6.2.1. - Trace statistics File, Mode (Save on target then upload)
- The statistical information is first saved in a file on the target, then uploaded to your workspace.
- Trace statistics File, Filename on target
- Name of the file used to save the statistical information on the target.
- Buffers, Number of kernel buffers
- Size of the static ring of buffers allocated in the kernel.
- Buffers, Number of qconn buffers
- Maximum size of the dynamic ring of buffers allocated in the qconn target agent.
Capturing instrumentation data in event log files
Regardless of how your log file is captured, you have a number of different options for how to regulate the amount of information actually captured:
- On/Off toggling of tracing
- Static per-class Off/Fast/Wide mode filters
- Static per-event Off/Fast/Wide mode filters
- User event-handler filters
(For more information, see the SAT User's Guide.)
The IDE lets you access the first three of the above filters. You can enable tracing (currently done by activating the Log Configuration dialog), and then select what kind of data is logged for various events in the system.
The events in the system are organized into different classes (kernel calls, communication, thread states, interrupts, etc.). You can toggle each of these classes in order to indicate whether or not you want to generate such events for logging.
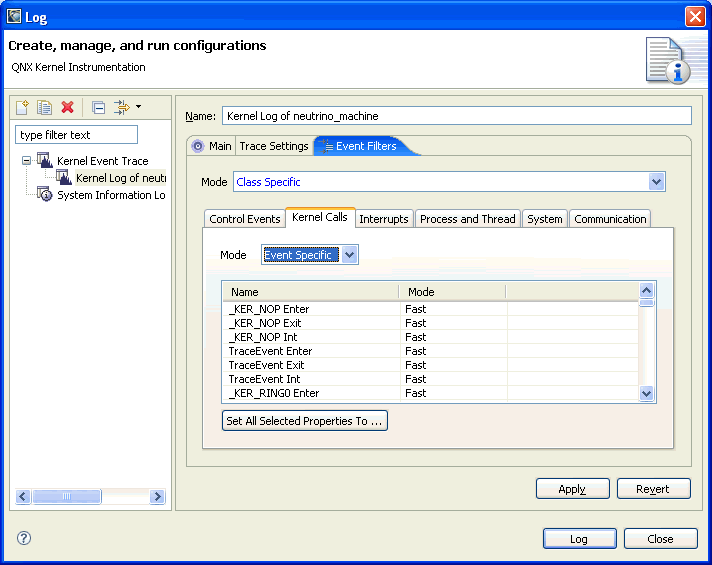
The data logged with events comes in the following modes:
- Fast mode
- A small-payload data packet that conveys only the most important aspects of the particular event. Better for performance.
- Wide mode
- A larger-payload data packet that contains a more complete event definition, with more context. Better for understanding the data.
- Class Specific
- This mode lets you select Disable (no data is collected), Fast, Wide,
or Event Specific for each of the following event classes:
- Control Events
- Interrupts
- Process and Thread
- Container
- Communication
Choosing Event Specific lets you select Disable, Fast, or Wide for each event in that class.
Depending on the purpose of the trace, you'll want to selectively enable different tracing modes for different types of events so as to minimize the impact on the overall system. For its part in the analysis of these events, the IDE does its best to work with whatever data is present. (But note that some functionality may not be available for post-capture analysis if it isn't present in the raw event log. ;-))
Viewing and interpreting the captured data
Once an event file is generated and transferred back to the development host for analysis (whether it was done automatically by the IDE or generated by using tracelogger and manually extracted back to the IDE), you can then invoke the System Profiler editor.
Log files are loaded in a nonmodal activity that you can cancel. This lets you load multiple log files at the same time, and log file data can be normalized as a background task when it's out of order. The display will show data up to the point where the log file has been processed.
|
If you receive a "Could not find target: Read timed out"
error while capturing data, it's possible that a CPU-intensive program
running at a priority the same as or higher than qconn is
preventing qconn from transferring data back to the host
system.
If this happens, restart qconn with the qconn_prio= option to specify a higher priority. You can use hogs or pidin to see which process is keeping the target busy, and discover its priority. |
The IDE includes a custom perspective for working with the System Profiler. This perspective sets up some of the more relevant views for easy access.
Searches in the System Profiler occur in the background, with results displayed as they're found. The results of each search operation are managed separately and are "overlaid" on top of one another, allowing multiple search results to be graphically viewed together in the System Profiler timeline editor pane. You can configure the table that's displayed in the search result view to display only the interesting trace event fields. The content of this table can be cut and pasted to the system clipboard as CSV-format data.
The tracing of kernel events from the IDE is performed as a background task. You can monitor the progress of the trace by opening the Progress view.
In the System Profiler editor's Timeline pane, you can navigate to the next or previous event limited to only those event owners. This lets you follow a sequence of events generated by a particular set of event owners (for example finding the next event owned by a thread, or the messages generated by a client and server).
In locations where single events have been identified (for example, the Trace Log view, Search Results view), you can navigate directly to the event location in the System Profiler timeline editor pane by double-clicking. The selection marker is moved to the event location and, if possible, the specific event owner is scrolled into view in the timeline editor pane.
The Navigate menu contains a Go To Type command that lets you jump directly to a specific type to allow developers to collaborate more easily with one another. Navigating by type provides direct navigation to the following: namespace, typedef, class, enum, struct, and union.
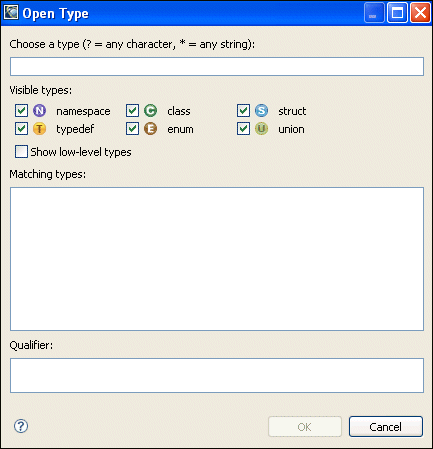
The System Profiler's Go To Event command.
These components of the QNX System Profiler are described in detail later in this chapter:
- System Profiler editor
- Bookmarks view
- Client/Server CPU Statistics view
- Condition Statistics view
- CPU Migration pane
- Event Owner Statistics view
- General Statistics view
- Raw Event Data pane
- Overview view
- Partition Summary pane
- Thread State Snapshot pane
- Timeline State Colors pane
- Trace Event Log view
- Why Running? pane
There are a number of additional components outside of the editor that you can use to examine the event data in more detail:
Trace Search panel
Invoked by Ctrl-H (or via ), this panel lets you execute more complex event queries than are possible with the Find dialog.
You can define conditions, which may include regular expressions for matching particular event data content (e.g. all MsgSend events whose calling function corresponds to mmap()). You can then evaluate these conditions and place annotations directly into the System Profiler editor. The results are shown in the Search view.
Unlike the other search panels in the IDE, the Trace Search panel can search for events only in the currently active System Profiler editor. You use this search panel to build conditions and then combine them into an expression. A search iterates through the events from the active log file and is applied against the expression; "hits" appear in the Search Results view and are highlighted in the System Profiler editor.
By default, the Trace Search panel returns up to 1000 hits. You can change this maximum in the Preferences dialog (choose ).
Properties view
This view shows information about the log file that was captured, such as the date and time, as well as the machine the log file was captured on.
Filtering a profile
The IDE lets you filter profile data so that you can look at a subset of the captured information. You can specify filtering on the following items:
- processes
- events
- saved filters
To filter profile data:
- After you've begun running your process(es) and started kernel logging for a project, you can select to change to the Timeline editor state.
- Right-click on the Timeline canvas and select Filter.
- Specify your desired filtering options on the following tabs:
Notice that the Timeline will dynamically change (for the specified time range) based on the filtering selections you make.
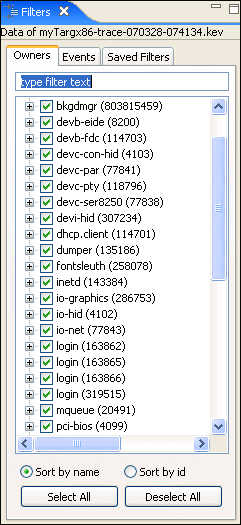
- On the Owners tab, select only those processes that you want to observe system profile data for. Click Deselect All to quickly deselect all of the processes, and then you can select only those that you want to monitor.
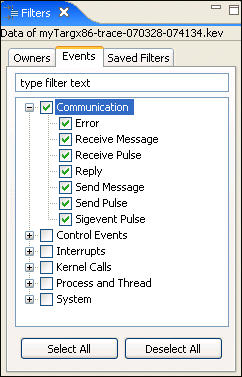
- On the Events tab, you can specify the events that you want to filter on, such as interrupts, communication, kernel calls, and various other events. Click Deselect All to quickly deselect all of the events, and then you can select only those that you want to monitor.
- On the Saved Filters tab, you can filter in or out based on custom filters; these are pre-existing filters within the IDE. For example, If you select CPU Usage and then click the Show Only button, the IDE will filter out any event owners that didn't use CPU time. Click the Add button to add the currently selected item to the list of items being filtered; the results will dynamically display in the Timeline. Click Remove to filter out the selected item; its corresponding data will be removed from the Timeline.
System Profiler use cases
This section describes some cases where you'd use the System Profiler:
- locating sources of high CPU usage
- mapping and isolating client CPU load from server CPU load
- examining interrupt latency
- locating events of interest
Locating sources of high CPU usage
In many cases you want to know where in time your CPU cycles are being consumed and who is doing the consuming. The System Profiler provides several tools to help extract this information and "drill down" to quickly and easily determine the source and distribution of CPU consumption.
Requirements
To extract CPU usage metrics using the System Profiler tools, the captured log file must contain at a minimum, the Neutrino RUNNING thread state. If the RUNNING thread state is logged in wide mode, then additional information regarding CPU usage distribution over priority and partitions can also be calculated.
If you need to determine the CPU load caused by interrupts, then you must also log the Interrupt Entry/Exit events.
Procedure
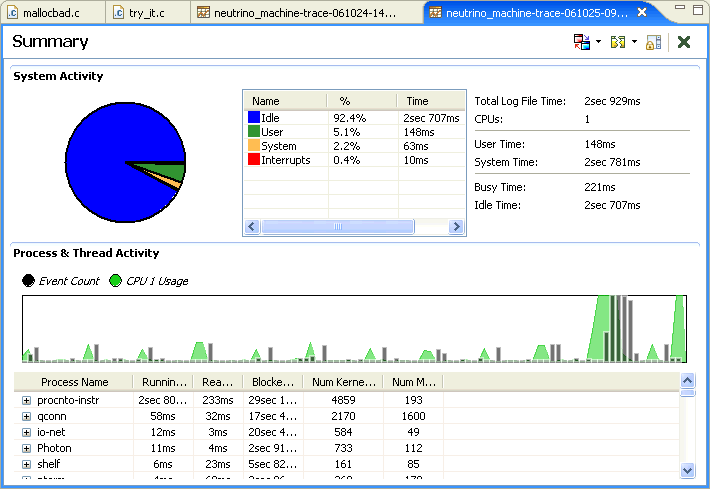
To start, open the target log file in the System Profiler editor. By default the initial display should show the Summary editor pane; if this isn't the case, then you can get to the Summary editor pane via the menu item .
The Summary editor pane shows a high-level overview of the log file contents:
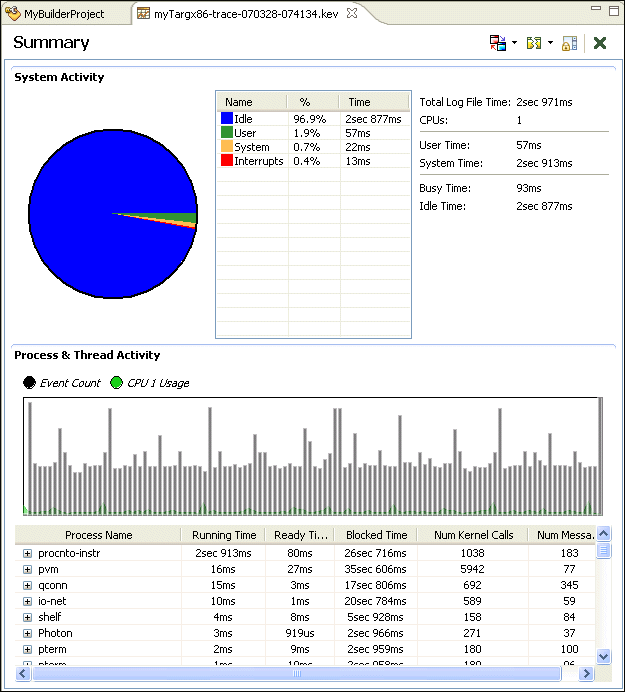
The System Activity section displays the distribution of time spent in the log file, carved into these broad categories:
- Idle
- The amount of time that the idle thread(s) spent running in this log file.
- Interrupts
- The amount of time that has been spent servicing hardware interrupts in this log file.
- System
- The amount of time that has been spent making kernel calls (measured between kernel entry and exit events). This time doesn't include any of the time spent handling hardware interrupts.
- User
- The amount of time that nonidle threads spend in the Neutrino RUNNING state, minus the time spent performing kernel calls or in interrupt handlers.
Using these metrics, you can get a rough estimate of how efficiently your system is performing (e.g. amount of idle time, ratio of system to user time, possible interrupt flooding).
The distribution of CPU usage over the time of the entire log file is displayed graphically in the Process & Thread Activity section overlaid with the volume of events that have been generated. This same data is also available as the Overview view accessed via .
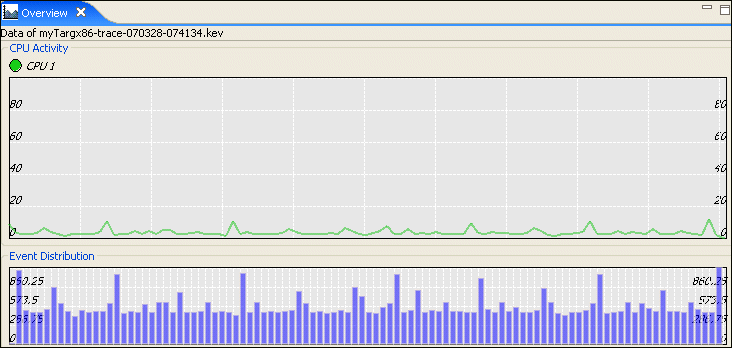
The peaks of this display indicate areas of particularly intense CPU usage and are the areas of most interest.
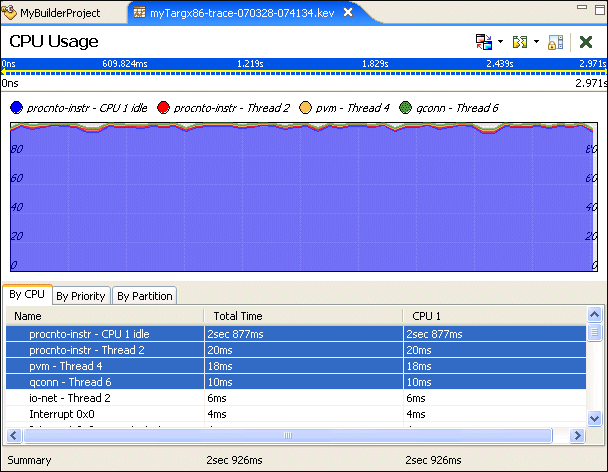
To focus on the particular threads that are causing these spikes, switch the editor display pane to the CPU Usage editor pane. You can do this via the menu item or directly using the editor pull down.
The CPU Usage editor display charts the CPU usage of consuming elements (threads and interrupts) over time and provides a tabular display showing the sum of this usage categorized by CPU, priority, or partition.
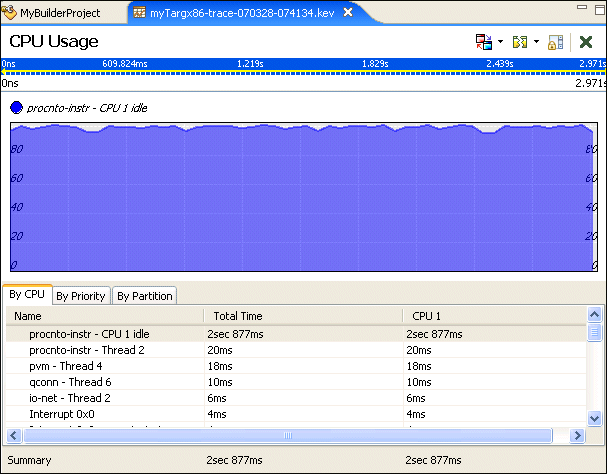
By selecting multiple elements in the table, you can "stack" the CPU usage to see how threads and interrupts are interacting. For example, selecting the first few nonidle CPU consumers in this example provides the following display:
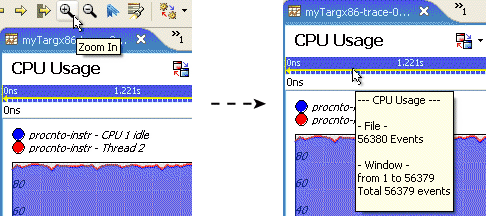
By selecting a region of the display, you can zoom in to the area of interest to further drill down into selected areas to better examine the profile of the CPU execution. As the display zooms in, the editor panel's time bar is updated to show the new range of time being examined.
This example has shown the CPU usage for process threads, but this technique applies equally well to individual interrupt handlers, which show up as CPU consumers in the same manner as threads.
The CPU Usage editor pane lets you isolate and assign CPU consumption behavior to specific threads very quickly and easily. With this information, you can generally use a more specialized, and application centric, tool such as the Application Profiler to look more closely at execution behavior and to drill down directly to the application source code.
Mapping and isolating client CPU load from server CPU load
There are many cases where high CPU load is traced back to server activity. However, in most cases what is required to reduce this CPU load isn't to make the servers more efficient, but to look more closely at the client activity that is causing the servers to run.
Requirements
|
Make sure you've read and understood "Locating sources of high CPU usage" before examining this use case. |
In addition to the Neutrino RUNNING thread state, the log must contain the communication events SEND/RECEIVE/REPLY|ERROR. These communication events are used to establish the relationship between clients and servers.
Procedure
QNX Neutrino systems rely heavily on client/server communications most often performed via message passing. In these systems, clients send requests to servers asking them to do work on their behalf such as shown:
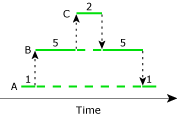
Here, A's real CPU usage would be considered to be 2 units of time, B's as 10, and C's as 2 units of time. Since B and C are both acting as servers, they really execute only when there are clients generating requests for action. Most standard CPU Usage metrics don't take this type of "on behalf of" work into consideration. However, if the goal of a kernel log file investigation is to locate the source or sources of CPU load, then this type of metric is invaluable in assigning "blame" for high CPU usage.
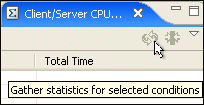
The System Profiler provides the Client/Server CPU Statistics view to help extract this type of "on behalf of" metric. You can activate this view via the .
Once activated, the Client/Server CPU Statistics are gathered on demand, by default, targeting the full range of the target log file:
The default display of this view shows the simplified view that displays the RUNNING time (slightly different from the CPU Usage in that it doesn't remove the time spent interrupted by interrupt handlers) that CPU consumers are consuming directly, indirectly, and summed together as a total:
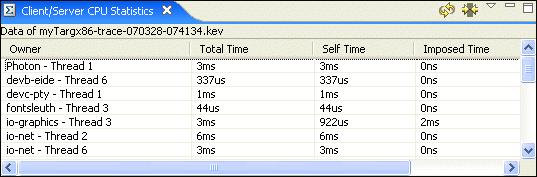
In this case, it's clear that while the qconn- Thread 1 isn't consuming much CPU on its own, it's imposing a significant amount of time on the system indirectly. If you compare this data to what the CPU Usage editor pane displays, you'll see the difference in what's reported:
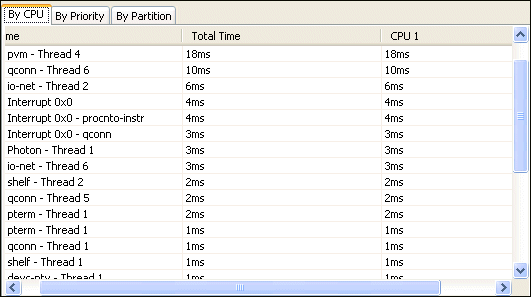
In the CPU Usage table, procnto- Thread 8 ranks ahead of qconn- Thread 1 in its usage. However, procnto is a pure server process, so we know that it consumes no CPU resources without being solicited to do so. We suspect that perhaps qconn- Thread 1 is driving procnto- Thread 1.
We can confirm this suspicion by looking at which servers qconn- Thread 1 is imposing CPU usage on. You can configure the Client/Server CPU Usage view to display all of the CPU consumers that are being imposed on (and by whom) by selecting Show all times from the view's dropdown menu:
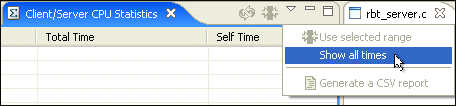
The Client/Server CPU Usage view table changes to show all of the imposed-on servers that clients are communicating with. The servers are listed in the columns and the clients in the Owner column. Note that this may result in a table with many columns (imposed on servers):
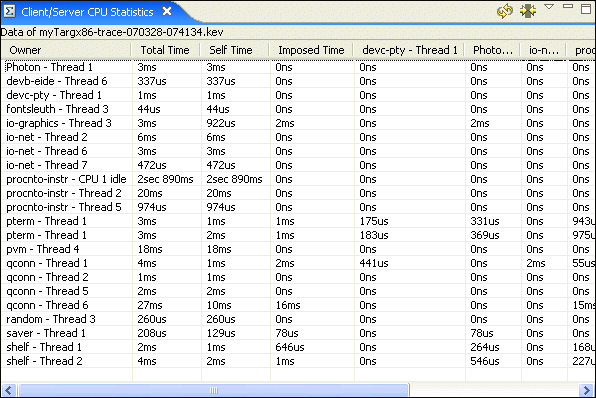
Here we can see that in fact nearly all of the time that procnto- Thread 8 is spending consuming CPU is due to requests coming from qconn- Thread 1, with only a minimal amount being imposed on it by another qconn thread, qconn- Thread 6.
This is to be expected, since in order to query the system, the qconn process must communicate with the kernel to extract the system state and all the process and thread information.
Examining Interrupt Latency
There are several different types of interrupt latency that you can measure in a system:
- the time from the HW signal generation to the start of software processing
- the time it takes before a non-OS control function can be invoked in response to the interrupt
- the time it takes for a user thread to be activated in response to this type of external event
The System Profiler, as a type of software logic analyzer, helps you look at the timing of activities once the interrupt has been acknowledged by the operating system. In order to accurately measure the time between the signal generation and the acknowledgment of it, you need additional hardware tools.
Requirements
To measure interrupt service time (the time taken for the operating system to acknowledge the interrupt, handle it, and return to normal processing), you must log the Neutrino Interrupt Entry/Exit events.
If you're interested in the time from the operating system's acknowledgment to a service handling routine, then you also need to capture the Interrupt Handler Entry/Exit events in the log file.
To properly gauge the latency in triggering a response in user code, you should also log the Neutrino thread READY and RUNNING states, in addition to the communication PULSE events, since these are often used to trigger a user application's behavior in response to an interrupt.
Procedure
Interrupt activity is best viewed in the System Profiler editor using the Timeline editor pane. Open the target log file in the System Profiler editor. Switch to the Timeline editor pane via the menu item .
You should see a display that resembles the following. The details will of course be different, but the layout similar:
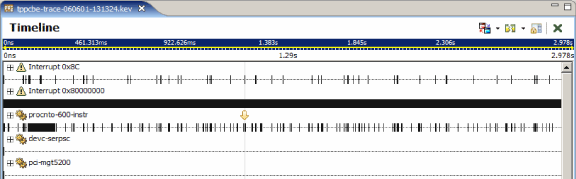
This display shows the various event owners/sources (interrupts, interrupt handlers, processes and threads) as a tree with their associated events arranged horizontally as a timeline.
If you've logged Interrupt Handler Entry/Exit events, then you should be able to expand the interrupt entries to show the various handlers (more than one handler can be attached to service an interrupt source), such as the following:
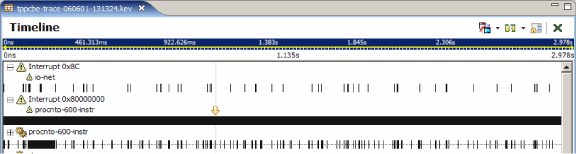
Here you can see that the io-net process has attached to Interrupt 0x8c and that procnto has attached to Interrupt 0x800000000, which on this system is the timer interrupt firing once every millisecond or so.
You can determine how many interrupt events are occurring in this log file by using the General Statistics view. This view is part of the default System Profiler perspective, and you can also access it via .

If you use the refresh button, this view extracts the event statistics for the entire log file (default), or for just the selected area if specified. Doing that results in the following display:
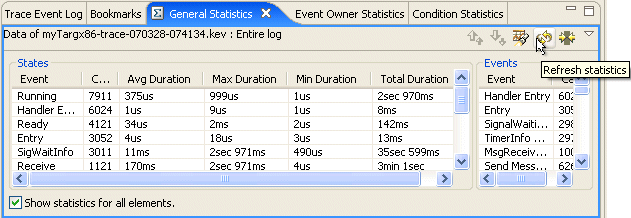
This table provides a breakdown for all of the event sources, showing the number of raw events and also the maximum, minimum, average, and total duration of the various Neutrino thread states in this log file.
If you're interested in only the events associated with the timer interrupt (Interrupt 0x80000000), you can select that event owner in the Timeline editor pane:
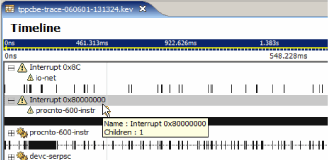
Next, uncheck the Show statistics for all elements check box at the bottom of the General Statistics view:
The General Statistics view tables will show the content limited to just the selected event owners.
Using this technique, you can get an estimate of the rough order of magnitude of how many events you're looking at in a log file, and in the case of interrupts, you can see some of the statistics about what the maximum, minimum, average, and total times spent were.
This display also lets you drill down further into the results, by allowing navigation in the Timeline editor pane directly to the maximum and minimum times, where you can look at the exact timing sequences. To do this, select one of the entries in the States table, and then right-click or use the toolbar to jump to the appropriate selection.
To look at the timing sequence of an interrupt, you usually have to zoom in on the timeline a significant amount to achieve an adequate level of visual detail, since interrupt processing is in general fast compared to the length of the log files. If you zoom into an area where a networking interrupt is being processed, the Timeline editor pane will change to look something like:
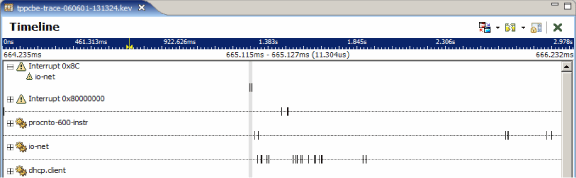
At this level of granularity, it also helps to see the trace event log concurrently with the Timeline editor pane. This is part of the standard System Profiler perspective, and you can access it using . The Trace Event Log and the Timeline editor pane are synchronized; when you change your cursor in the editor, the selection in the Trace Event Log view also changes and vice versa.
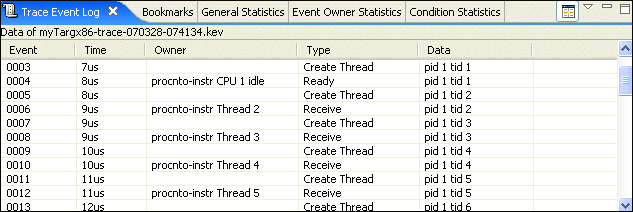
The selection synchronization is shown here. In the Trace Event Log view, we've selected the Interrupt 0x8c Entry event through to the Interrupt 0x8c Exit event. This represents the start to end of the processing of the interrupt event. In the timeline display, this selection is made and the timing measurement of 11.304 microseconds is displayed:
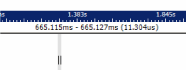
So the total interrupt handling time from start to end of the operating system interrupt service routine, including the event handler was 11.304 microseconds. If you want to just look at the handling time for interrupt handler attached by the io-net process, you can see that this time is only 8 microseconds. These times represent the earliest and latest points in time that can be measured before entering/exiting control of the software.
You can also see in this example that the io-net interrupt handler is returning a pulse that's triggering something in the user's application (event 13515) and that an io-net thread is then scheduled to service that request. You can also measure this latency to determine how long it takes to go from operating system awareness of the interrupt to eventual application processing, using the same selection technique:

There are many different choices in terms of what time ranges are of interest to measure. Here we've decided to measure from the time that the operating system is aware of the interrupt (event 13511) through to the point at which the user process has started to respond to the signal generated by the io-net interrupt handler. Since the interrupt handler communicates using a pulse (event 13515), then the earliest that the user code can respond is when the MsgReceive() kernel call exits (event 13519) with the received pulse. In this case, we can see that the end-to-end latency from OS awareness to the start of user processing (nonprivileged) is 46.304 microseconds:
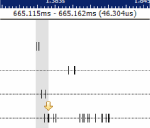
Alternate measurements that could be of interest and that you can easily examine include:
- The time that it takes for the user process to be scheduled rather than the time for it to start processing. This would be signified by a transition of one of the receiving process's (io-net) threads to a READY or RUNNING state (event 13516 for example). This time may be significantly different from the actual start of processing time in busy systems with execution taking place with mixed priorities.
- The time between the end of specific interrupt handler processing, and the awareness of the user process (either the scheduling or the start of processing) of the interrupt's occurrence. This timing can be quite relevant when there are multiple interrupt-handling routines sharing the interrupt that may skew the time before the interrupt handler starts its processing of the interrupt.
Locating Events of Interest
Trace event log files contain a wealth of information, but unfortunately that information is often buried deep in among thousands, if not millions, of other events. The System Profiler tooling helps provide tools to reduce and remove some of this "noise" to help you focus on the areas of a log that are important to you.
Requirements
There are no specific requirements for this use case, but some of the topics may not apply, depending on the types of events that have been captured.
Procedure
We'll walk through some of the tools available to help you to reduce and filter the data contained in a trace event file. Where this information is most useful is during investigations involving the Timeline editor pane. The timeline displays information with a very fine granularity and is often the display that users turn to in order to "single step" through the execution flow of an activity of interest. To open the Timeline editor pane, select .
Timeline editor pane filters
The first level of data reduction is to use the Filters view to remove information that isn't significant for the tracing of the problem you're interested in. The Filters view is synchronized with the active System Profiler editor; you can display it via the menu or by right-clicking Filters... in the Timeline editor pane.
This view provides you with the following types of filtering:
- The Owners tab shows a list of event owners/sources, letting you
select or unselect event owners to be displayed.
Unselecting an event owner in the list removes that owner from the
Timeline editor pane.
- The Events tab is similar to the Owners tab, but it provides filtering
capabilities for individual trace events rather than for the owners of
those events.
- The Saved Filters tab provides a listing of preconfigured filters that are available. These filters are often based on more sophisticated criteria for determining if events or event owners are to be displayed. The CPU Usage filter is an example of such a filter. It removes from the display any event owner that hasn't consumed any CPU resources within the current display area. By using this filter in conjunction with zooming and searching capabilities, you can quickly reduce the overall data set.
Trace event log filter synchronization
By default, the Trace Event Log view presents a display that uses the same filters as the currently active editor. However, there are times when it's useful to be able to temporarily "unfilter" the Trace Event Log view display to see the raw content of the log file. You can accomplish this by toggling the editor's Synchronize button on the Trace Event Log view display:

Timeline "find"
There are times when you're looking at an event stream and want to quickly navigate through it. One mechanism for doing this is to move to the next or previous event, using the toolbar commands (Next, Previous, Next Event In Selection, Previous Event In Selection).
Another, more flexible, alternative is to use the Find functionality of the Timeline editor pane. Selecting opens a dialog similar to the one found in many text editors:
The dialog supports searching a restricted set of event owners (based on the selection made in the Timeline editor pane) as well as searching forwards and backwards through the log file. This is convenient when you know specifically what type of event you're looking for in a sequence of events (e.g. the next RUNNING state for a thread).
The Find dialog moves the selection marker in the Timeline editor pane to the appropriate event.
Trace Search
If you need to generate a collection of events matching a particular condition, or you need to construct a more complicated expression (perhaps including event data) in order to find the events you're looking for, you need the power of trace event conditions and the Trace Search tool.
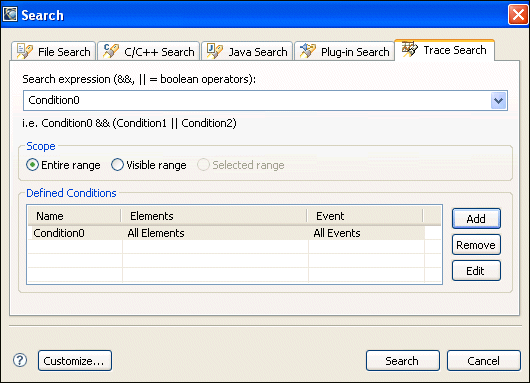
The search tool is invoked via the menu item . Opening this up presents a dialog similar to the following:
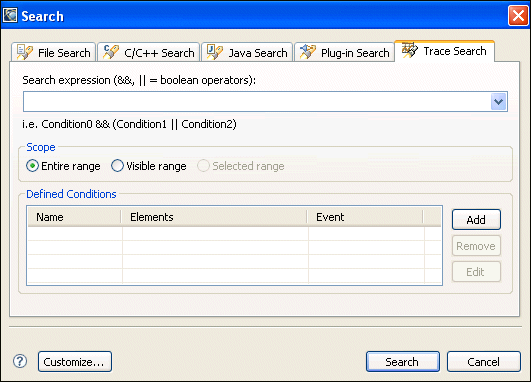
There are many different search mechanisms in Eclipse, but the Trace Search is the one that we're interested in as a "super find" for the event files.
Searching is based on trace conditions. Trace conditions describe a selection criterion for matching an event and can be based on anything that an event provides (ownership, data payload, and so on).
To add a condition that will locate all of the MsgSend() calls that may have been made for write system calls:
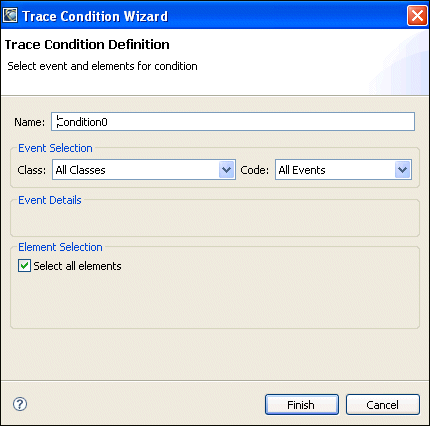
- Add a new condition via the Add button in the search dialog.
This brings up a new condition dialog that you can fill in with the
MsgSendv() kernel call and the write() function
entry to match.
When matching string values (such as function names), the matching is
done based on a regular-expression match.
- Once you've defined the condition, it shows up in the Defined Conditions
table shown in the Trace Search panel.
You can combine individual conditions to form Boolean expressions if
required.
- Specifying the newly created condition in the Search Expression drop-down
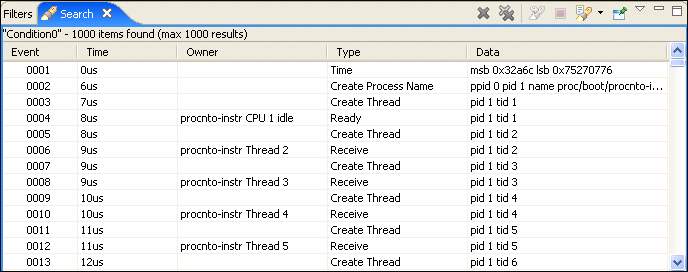
and selecting Search automatically opens up the Search Results view.
If the Timeline editor pane is open, double-clicking on a search result
(assuming that the result isn't filtered) moves the timeline selection
directly to that event:
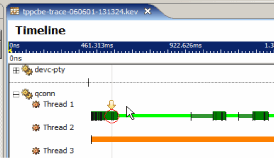
Search results are also marked in the timeline to help show the event distribution over the period of the log file:
Exporting filtered log files with Save As
Often the kernel event files that are captured are large and contain a significant amount of nonessential data for the problem at hand. Of course, this is generally only determined after the fact, once you've performed some basic analysis.
You can use the menu command to create a new log file that's based on the current log file in the System Profiler editor.
You can restrict the new log file to just the selected area (if you've made a selection), and you can also use the current filter settings (event and event owner) to reduce the amount of additional data that's stored in the log file.
The new log file contains the same attribute information as the original log file (including the system version, system boot time, number of CPUs, and so on). Any event owners, such as interrupts, processes, and threads, which are referenced by events in the new log file, are synthetically created with timestamps matching the start time(s) of the new log file.
Associated views
The QNX System Profiler perspective includes the following views:
- System Profiler editor
- Bookmarks view
- Client/Server CPU Statistics view
- Condition Statistics view
- CPU Migration pane
- Event Owner Statistics view
- General Statistics view
- Raw Event Data pane
- Overview view
- Partition Summary pane
- Thread State Snapshot pane
- Timeline State Colors pane
- Trace Event Log view
- Why Running? pane
System Profiler editor
In order to start examining an event file, the easiest way is to name it with a .kev (kernel event) extension. Files with this extension are automatically bound to the System Profiler editor.
The System Profiler editor is the center of all of the analysis activity. It provides different visualization options for the event data in the log files:
The System Profiler editor panes include the following:
- Summary pane (the default)
- Displays a summary of the activity in the system, accounting for how
much time is spent processing interrupts, running system- or kernel-level
code, running user code, or being idle.
The IDE generates an overview of the CPU and trace event activity over the period of the log file. This overview contains the same information displayed in the Overview view.
The process activity (amount of time spent RUNNING or READY, number of kernel calls) displayed in the Summary pane contains the same information as can be extracted by drilling down for a particular time range of the event log using the General Statistics and Event Owner Statistics views.
- CPU Activity pane
- Displays the CPU activity associated with a particular thread of process. For a thread, CPU activity is defined as the amount of runtime for that thread. For a process, CPU activity is the amount of runtime for all the process's threads combined.
- CPU Usage pane
- Displays the percent of CPU usage associated with all event owners. CPU usage is the amount of runtime that event owners get. CPU usage can also be displayed as a time instead of a percentage.
- Timeline pane
- Displays events associated with their particular owners (i.e. processes, threads, and interrupts) along with the state of those particular owners (where it makes sense to do so).
The Summary pane is the default. To choose one of the other types, right-click in the editor, then select , or click this icon:

You can choose a specific display type by from the dropdown menu associated with this menu item or icon.
For the CPU Activity pane, you can display the data using your choice of graph by right-clicking the graph and choosing Graph Type. Select one of the graph types from the list:
- Line Chart
- Bar Chart
- Histogram
- Area Chart
3D versions of the charts are also available.
Each of these visualizations is available as a "pane" in a stack of "panes." Additionally, the visualization panes can be split -- you can look at the different sections of the same log file and do comparative analysis.
All panes of the same stack share the same display information. A new pane inherits the display information of the previous pane, but becomes independent after it's created.
To split the display, right-click in the editor, then select , or click this icon:

You can lock two panes to each other. From the Split Display submenu, choose the graph you want to display in the new pane, or click this icon:

|
You can have a maximum of four panes displayed at once. |
A number of different features are available from within the editor:
- Event owner selection
- If you click on event owners, they're selected in the editor.
These selected event owners can then be used by other
components of the IDE (such as Find).
If an owner has children (e.g. a parent process with threads), you'll see a plus sign beside the parent's name. To see a parent's children, click the plus sign.
- Filters
- You can use the Filters view to filter out
event owners and specific events.
This lets you significantly cut down on
the unwanted event "noise" in the display.
You can then save a new version of the log file (using
Save As) to produce a smaller, more succinct log
file for further examination.
For example, to view only processes that are sending pulses, choose to open the Filters view. Select the Events tab, and then replace type filter text with MsgSend. Click Deselect All, and then click the applicable MsgSend events that your search found. The selected events are added to your display dynamically.
- Find
- Pressing Ctrl-F (or selecting ) opens a dialog that lets you quickly move from event to event. This is particularly useful when following the flow of activity for a particular event owner or when looking for particular events. Note the Class and Code fields in the dialog are filled in with the values from the currently selected event in the Timeline pane.
- Bookmarks
- You can place bookmarks in the timeline editor just as you
would to annotate text files. To add a bookmark, click the Bookmark icon
in the toolbar
(
 ),
or right-click in the editor and choose
Bookmark from the menu.
),
or right-click in the editor and choose
Bookmark from the menu.
These bookmarks show up in the Bookmarks view and can represent a range of time or a single particular event instance.
- Cursor tracking
- The information from the System Profiler editor is also made available to other components in the IDE such as the Trace Event Log and the General Statistics views. These views can synchronize with the cursor, event owner selections, and time ranges, and can adjust their content accordingly.
- IPC representation
- The flow of interprocess communication (e.g. messages,
pulses) is represented by a vertical arrow between the two
elements.
You can toggle IPC tracing on/off by clicking this button in the toolbar:

By default, this displays the IPC trace arrows for all event owners. You can choose to display only the arrows for the selected owners by choosing Selection from the button's dropdown menu.
- Display Event Labels
- The Display Event Labels button in the toolbar
(
 )
lets you display labels in the timeline; open the button's dropdown menu
and select the type of labels you want to display:
)
lets you display labels in the timeline; open the button's dropdown menu
and select the type of labels you want to display:
- Priority Labels -- display the thread's priority
- State Labels -- display the thread's state as a label
- State Icons -- display the thread's state as an icon above the thread
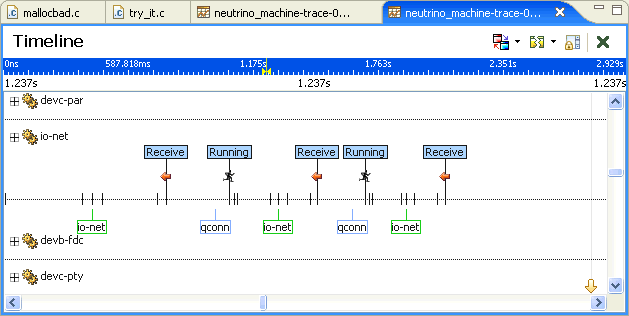
- IPC Labels -- add text boxes to the IPC lines to indicate which thread or process you're communicating with
- Event Labels -- display labels for kernel events, including I/O and memory events.
If you haven't expanded a process in the display, the labels for all its threads are displayed. By default, no labels are displayed.
Types of selection
Within the editor, you can select either of the following:
- an owner (e.g. a process or thread)
- a point in time
Owners
To select a single owner, simply click the owner's name. To unselect an owner, press and hold the Ctrl key, then click each selected owner's name.
To select multiple owners, press and hold the Ctrl key, then click each owner's name.
Time
To select a point in time, click an event on the timeline.
To select a range, click the start point on the timeline, then drag and release at the end point.
Or, select the start point, then hold down the Shift key and select the end point.
Zooming
When zooming in, the display centers the selection. If a time-range selection is smaller than the current display, the display adjusts to the range selection (or by a factor of two).
When zooming out, the display centers the selection and adjust by a factor of two.
When using a preset zoom factor (100% to 0.01%), the display centers the current selection and adjust to the new factor.
There are various ways to zoom:
- right-click menu ()
- toolbar icons
- hotkeys (+ to zoom in; - to zoom out)
Scrolling
You can use these keys to scroll through time:
| To move: | Use this key: |
|---|---|
| The selection to the left by one event | Ctrl-<-- |
| The selection to the right by one event | Ctrl---> |
| The display to the left | <-- |
| The display to the right | --> |
| The selection for the current owner to the left by one event | Ctrl-Shift-<-- |
| The selection for the current owner to the right by one event | Ctrl-Shift---> |
You can use these keys to scroll through the owners:
| To move the display: | Use this key: |
|---|---|
| Up by one owner | /\ |
| Down by one owner | \/ |
| Up by one page (horizontal scrollbar thumb size) | Page Up |
| Down by one page (horizontal scrollbar thumb size) | Page Down |
| To the top of the owner list | Home |
| To the bottom of the owner list | End |
Hovering
When you pause your mouse pointer over an owner or an event, you'll see relevant information (e.g. PID, timestamps, etc.).
Bookmarks view
Just as you can bookmark lines in a text file, in the System Profiler editor, you can bookmark particular locations and event ranges displayed, and then see your bookmarked events in the Bookmarks view.
Client/Server CPU Statistics view
The Client/Server CPU Statistics view () tracks the amount of client/server time spent in the RUNNING state. In a message-passing system, it may be that a particular thread is consuming a large amount of CPU time, but that CPU time is being consumed based on requests from one or more clients. In these cases, in order to achieve a higher performance, the client requests on the server must be reduced (assuming that the server is identified as a bottleneck).
This panel provides a tabular display of threads that spend time in a RUNNING state (slightly different from pure CPU usage) and breaks down the display such that for each thread there is a summary of how much time it spent directly in the RUNNING state and how much RUNNING time it "imposed" on other threads in the system and the total of those two times.
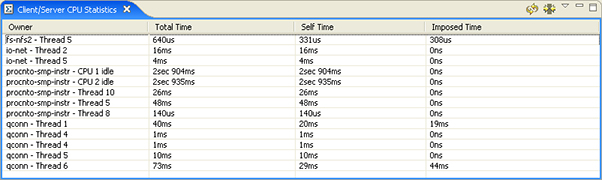
The System Profiler's Client/Server CPU Statistics view.
You can expand the table, via the View menu, to show how much time the client imposed on various server threads. The imposed time is cumulative: if client A sends to server B, then until B replies to A, any time that B consumes is seen as "imposed on" time. If during that time B sends to server C, then server C is also billed time as "imposed on" by A. The rationale here is that B would not have engaged with server C were it not for the initial message from A.
By sorting by imposed time, it is possible to identify which clients are predominantly driving the system and which servers may be bottleneck points.
Condition Statistics view
This view provides a tabular statistical representation of particular events. The statistics can be gathered for the entire log file or for a selected range.
When you first open the Condition Statistics view, it contains no data:
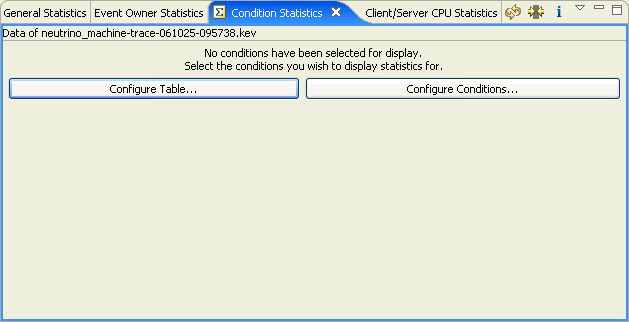
You must configure conditions and the table to view condition statistics.
Configuring conditions
To configure conditions for the Condition Statistics view:
- Click the Configure Conditions... button, or choose
Configure Conditions... from the view's drop-down
menu (
 ).
).
The IDE displays the Modify Conditions dialog.
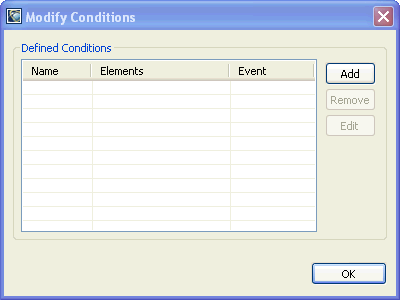
- Click the Add button to bring up the Trace Condition Wizard.
The IDE displays the Trace Condition Wizard dialog:
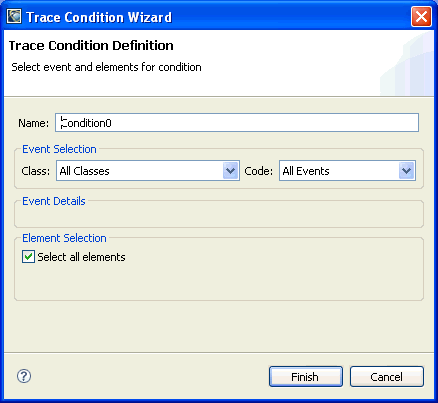
- Give your condition a unique name and select the appropriate class and code. For example, select Process and Thread from the Class dropdown menu, then select Mutex under the Code dropdown menu.
- Click Finish.
- Click OK in the Modify Conditions dialog.
- Click the Configure Table Condition Contents
(
 )
button, or choose Configure Table... from the view's dropdown menu.
)
button, or choose Configure Table... from the view's dropdown menu.
The IDE displays the Condition Selection dialog:
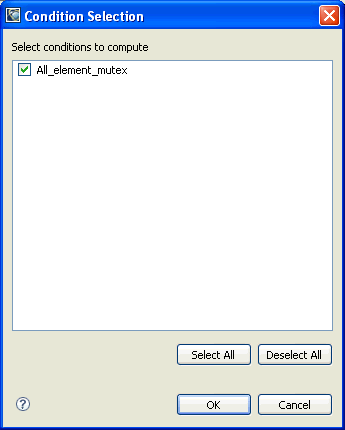
- Add a check mark beside the conditions that you want displayed in the table.
- Press OK to confirm your selections.
|
You'll need to click the Refresh button
( )
to populate this view with data. )
to populate this view with data. |
CPU Migration pane
The CPU Migration pane provides a display that draws attention to some of the potential performance problems associated with multiple-CPU systems. This is principally concerned with CPU migration activities.
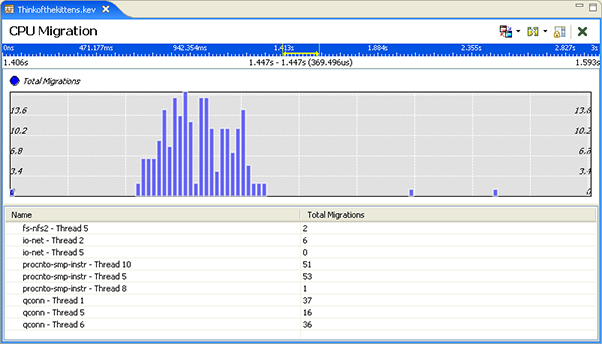
The System Profiler's CPU Migration pane.
There are two migration details that are currently charted over the period of the log file:
- The first chart provides a display showing the number of CPU- scheduling migrations over time. The count is incremented each time a thread switches CPUs. The peaks in this chart indicate areas where there's a high level of contention for particular CPUs. This type of cross-CPU migration can reduce performance because the instruction code cache is flushed, invalidated and then reloaded on the new CPU.
- The second chart provides a display showing the count of cross-CPU communication, where the sending client thread and the receiving server thread are running on different CPUs. This type of cross-CPU communication on the initial message-sends is a potential performance problem since the data that is associated with the message-pass can't be maintained in the processor data cache, and the caches must be invalidated, as the data transfer is moved to the new CPU.
This pane contains valid data only when the log file contains events from a system where there are multiple CPUs.
Event Owner Statistics view
This view provides a tabular statistical representation of particular events. The statistics can be gathered for the entire log file or for a selected range.
|
You'll need to click the Refresh button () to populate this view
with data. |
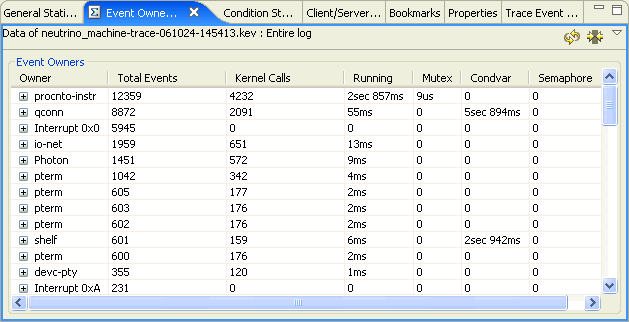
General Statistics view
This view provides a tabular statistical representation of particular events. The statistics can be gathered for the entire log file or for a selected range.
|
You'll need to click the Refresh button () to populate this view
with data. |
Raw Event Data pane
The Raw Event Data view () lets you examine the data payload of a particular selected event. It shows a table of event data keys and their values. For example if an event is selected in the Trace Log view, rather than attempting to look at all of the data in the single line entry, you can open the Raw Event Data view to display the data details more effectively.
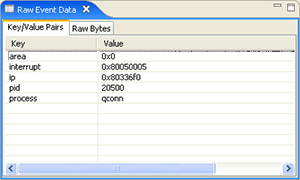
The System Profiler's Raw Event Data view.
Overview view
The Overview view () shows two charts spanning the entire log file range.
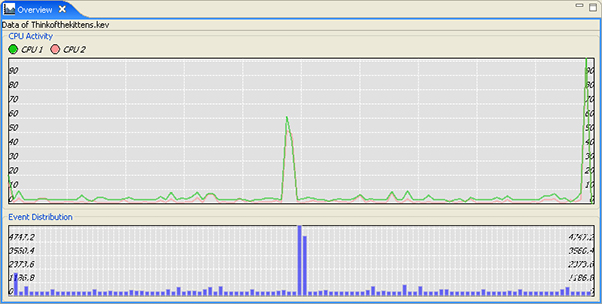
The System Profiler's Overview view.
These charts display the CPU usage (per CPU) over time and the volume of events over time. The Overview reflects the current state of the active editor and active editor pane. You can select an area of interest in either one of the charts; then, using the right-click menu, zoom in to display only that range of events to quickly isolate areas of interest due to abnormal system activity.
Partition Summary pane
The Partition Summary pane provides a summary of the entire log file, focused on QNX's adaptive partitioning technology. For each distinct configuration of partitions detected in the log file, the distribution of CPU usage used by those partitions is displayed, along with a tabular display showing the distribution of CPU usage per event owner per partition.
You can use this information in conjunction with the CPU Usage editor pane to drill down into areas of interest. This pane contains valid data only when the log file contains partition information, and the process and thread states are logged in wide mode (so the partition thread scheduling information is collected).
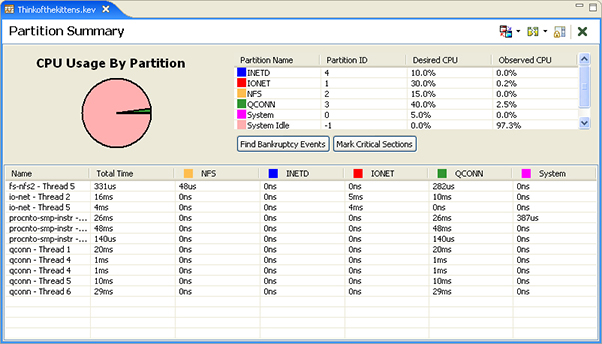
The System Profiler's Partition Summary pane.
You can also get snapshots of the usage of the adaptive partitioning on your system through the System Information perspective's Partition Summary view. For more information, see the "Getting System Information" chapter.
Thread State Snapshot pane
In addition to asking why a particular process's thread may be running, developers are often faced with the task of understanding what the rest of the system is doing at a particular point in time. This question can easily be answered using the Thread State Snapshot view ().
Like the Why Running? view, this view is keyed off of the current cursor position in the System Profiler editor Timeline pane. For a given time/position, it determines the state of all of the threads in the system and presents that list to you in such a fashion that you can then determine if this "system state" is what you'd anticipated.
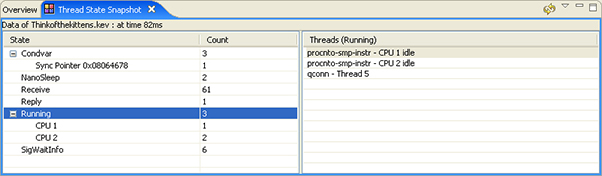
The System Profiler's Thread State Snapshot view.
Note that you must click the refresh icon in the Thread State View's toolbar to update the contents of the Thread State View when you select a point in the Timeline.
Timeline State Colors pane
You can use the Timeline State Colors view () if you're unfamiliar with the System Profiler timeline editor pane state colorings, or if you'd like to change the color settings to something more appropriate for your task.
The view displays a table with all of the color and height markers that are used when drawing the timeline display. These settings can be bulk imported and exported using the view's dropdown menu based on particular task requirements. The default settings generally categorize states with similar activities together (synchronization, waiting, scheduling, etc.).
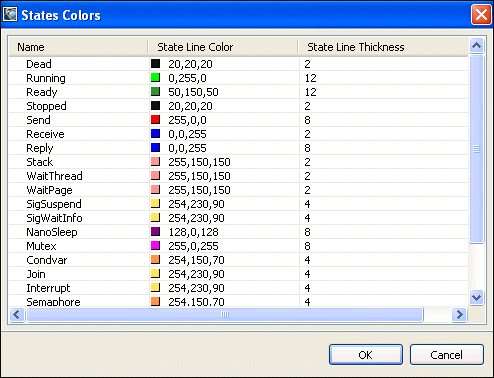
The System Profiler's Timeline State Colors view.
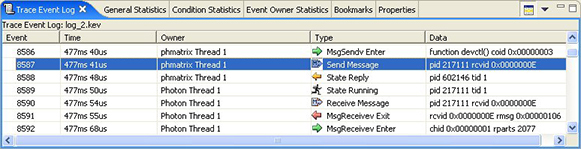
Trace Event Log view
This view can display additional details for the events surrounding the cursor in the editor. The additional detail includes the event number, time, class, and type, as well as decoding the data associated with a particular event.
Why Running? pane
The Why Running? view () works in conjunction with the System Profiler timeline editor pane to provide developers with a single click answer to the question "Why is this thread running?" where "this thread" is the actively executing thread at the current cursor position.
By repeating this action (or generating the entire running backtrace) developers can get a clearer view of the sequence of activities leading up to their original execution position. Not to be confused with an execution backtrace, this "running backtrace" highlights the cause/effect relationship leading up to the initial execution position.
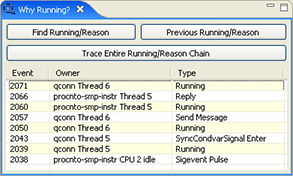
The System Profiler's Why Running? view.
|
|
|
|